We have compiled a list of manufacturers, distributors, product information, reference prices, and rankings for Analysis.
ipros is IPROS GMS IPROS One of the largest technical database sites in Japan that collects information on.

Analysis Product List and Ranking from 182 Manufacturers, Suppliers and Companies

Last Updated: Aggregation Period:Oct 15, 2025~Nov 11, 2025
This ranking is based on the number of page views on our site.

Analysis Manufacturer, Suppliers and Company Rankings

Last Updated: Aggregation Period:Oct 15, 2025~Nov 11, 2025
This ranking is based on the number of page views on our site.

  1. 一般財団法人材料科学技術振興財団 MST Tokyo//Testing, Analysis and Measurement
  2. 同仁グローカル Kumamoto//others
  3. ビーエルテック Tokyo//Testing, Analysis and Measurement
  4. 4 クラスターテクノロジー 本社 Osaka//Resin/Plastic
  5. 5 西進商事 Hyogo//Industrial Machinery

Analysis Product ranking

Last Updated: Aggregation Period:Oct 15, 2025~Nov 11, 2025
This ranking is based on the number of page views on our site.

  1. Fatty Acid Analysis [Analysis Case] 同仁グローカル
  2. Analysis, precision balance │ EXPLORER series *Comprehensive catalog available オーハウス コーポレーション 日本支社
  3. Seawater Nutrient Measurement Device Quattro ビーエルテック
  4. 4 Certified single-element and mixed standard solutions for ICP-AES/ICP-MS wet analysis. 西進商事
  5. 5 [Information] Understanding Chemikan in 3 Minutes ケミカン

Analysis Product List

331~345 item / All 655 items

Displayed results

Shape Analysis System 'Shape Analyzer ver2.0'

Analysis such as cell counting, which takes hours, is completed in "about 3 seconds"! And at a low cost!

"Shape Analyzer ver2.0" automatically detects specific shapes just by importing images. Analysis tasks such as counting, which were previously done manually, can now be completed in just a few seconds. There's no need to invest in expensive microscopes like traditional automatic analysis devices! It can be used at an overwhelmingly low cost since it analyzes image files. 【Features】 ■ Fast analysis (approximately 3 seconds) ■ No individual differences in analysis results, ensuring accuracy ■ Easy analysis of complex shapes ■ Intuitive interface that anyone can use ■ Easy implementation of statistics and monitoring *Please refer to the catalog for detailed specifications and analysis screens.

  • Electron microscope
  • Image analysis software

Added to bookmarks

Bookmarks list

Bookmark has been removed

Bookmarks list

You can't add any more bookmarks

By registering as a member, you can increase the number of bookmarks you can save and organize them with labels.

Free membership registration

River and Lake Nutrient Measurement Device - SWAT

Nitrate, ammonia, phosphate, and silica in environmental water, wastewater, and sewage can be measured. (Continuous flow analysis method is used.)

It is used by government agencies, universities, and private water quality testing organizations. It can measure up to five items—nitrate, nitrite, phosphate, ammonia, and silica—simultaneously at a rate of 120 samples per hour. It is capable of a wide range of measurements, including rivers, brackish water, lakes, and environmental water. 【Features】 ■ Simultaneous measurement of up to five items—nitrate, nitrite, phosphate, ammonia, and silica—at a rate of 120 samples per hour ■ Wide range of measurements including rivers, brackish water, lakes, and environmental water ■ Excellent automation techniques ■ Outstanding cost performance ■ Listed in JIS and Ministry of the Environment notification laws *For more details, please refer to the PDF materials or feel free to contact us.

  • Water quality testing

Added to bookmarks

Bookmarks list

Bookmark has been removed

Bookmarks list

You can't add any more bookmarks

By registering as a member, you can increase the number of bookmarks you can save and organize them with labels.

Free membership registration

An analysis case using the CFA method for measuring nitrogen and phosphorus in seawater, etc.

Publication of case studies using the CFA method for the measurement of total nitrogen and total phosphorus in seawater and wastewater.

The nitrogen and phosphorus analysis using the auto-analyzer from Sanyo Techno Marine Co., Ltd. adopts the Continuous Flow Analysis (CFA) method, and we are currently using our "QuAAtro2-HR." When introducing flow analysis methods, the focus is generally on improving efficiency, but after implementation, there are unique challenges and innovations in equipment management from the users' perspective. This document reports on the insights gained by Sanyo Techno Marine Co., Ltd. as a user. [Contents] ■ Overview of the analytical equipment Analysis methods and specifications of the equipment in use ■ Comparison of this model with manual analysis Comparison of manual analysis and CFA from the perspectives of "effectiveness" and "burden" ■ Contamination prevention measures in NH4-N analysis Measures to prevent contamination using soundproof boxes, etc. ■ Measures to address carryover in total nitrogen analysis ■ Summary *For more details, please refer to the PDF document or feel free to contact us.

  • image14.jpg
  • others
  • Analytical Equipment and Devices

Added to bookmarks

Bookmarks list

Bookmark has been removed

Bookmarks list

You can't add any more bookmarks

By registering as a member, you can increase the number of bookmarks you can save and organize them with labels.

Free membership registration

Continuous Flow Analysis System (CFA) "MiSSion"

Compatible with halogen and LED light sources! Vertical 2-channel system of the auto analyzer series.

We have newly released the continuous flow analysis device "MiSSion." It is a vertical two-channel system from the auto-analyzer series. The measurement principle is based on the flow analysis device using the absorbance method, specifically the bubble segmentation "CFA" method. The auto-analyzer series offers over 1,000 analytical methods for chemical analysis in fields such as environment, agriculture, fisheries, and chemistry, and is widely used in many analytical institutions. 【Features】 ■ Supports ultra-low concentration measurements ■ Can be equipped with halogen and LED light sources ■ Excellent maintenance capabilities ■ Temperature control function for the detector ■ New software *For more details, please refer to the PDF document or feel free to contact us.

  • 2020-06-08_16h27_05.png
  • 2020-06-08_16h27_08.png
  • 2020-06-08_16h27_12.png
  • Analytical Equipment and Devices
  • Logic Analyzer

Added to bookmarks

Bookmarks list

Bookmark has been removed

Bookmarks list

You can't add any more bookmarks

By registering as a member, you can increase the number of bookmarks you can save and organize them with labels.

Free membership registration

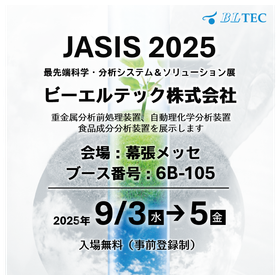
Analysis equipment contributing to automation in the environment and food industry *Exhibiting at JASIS 2025

A large number of analytical instruments that assist in the automation of processes from pre-treatment of the environment and food to measurement will be exhibited! We will participate in "JASIS 2025," where technologies related to science and analysis come together.

"JASIS 2025" is a science, analysis systems, and solutions exhibition that brings together numerous manufacturers of analytical instruments and scientific equipment that support advancements in science beneficial to people's lives. Various presentations and seminars on many new technologies will be held. There are over 1,000 analytical methods for chemical analysis in fields such as the environment, agriculture, fisheries, and chemistry. Products such as the Continuous Flow Analyzer (CFA) "MiSSion," which is used in many analytical institutions, and devices that contribute to the automation of environmental and food analysis, as well as improvements in efficiency and quality, including "Heavy Metal Analysis Pretreatment Device" and "Near Infrared Analyzer," will be showcased! [Exhibited Products] ■ Continuous Flow Analyzer 'MiSSion' ■ Fully Automatic Acid Decomposition Pretreatment Device 'AATM' ■ Fully Automatic Acid Decomposition Pretreatment Device 'DEENA2' ■ Near Infrared Analyzer 'SpectraStar XT' ■ Damage Starch Measurement Device 'SDmatic 2' *For details on the exhibited products, please refer to the <PDF download>. For more information on various products, please contact us.

  • s1.jpg
  • s2.jpg
  • s3.jpg
  • s4.jpg
  • s5.jpg
  • Other environmental analysis equipment

Added to bookmarks

Bookmarks list

Bookmark has been removed

Bookmarks list

You can't add any more bookmarks

By registering as a member, you can increase the number of bookmarks you can save and organize them with labels.

Free membership registration

Equipment Diagnostic Device Online Vibration Meter Mitaro Series MK-64

For constant vibration monitoring of motors, pumps, fans, etc., and equipment diagnostics! It features a digital meter display that is easy to understand at a glance. It supports all modes of acceleration, velocity, and displacement.

■□■Features■□■ ■Adopts an easy-to-read digital meter display Specifications that allow signal levels to be understood at a glance ■Alarms can be easily set digitally With the digital setting switch, any value can be easily set in 1% increments ■Equipped with level signal and alarm output functions Includes level signal (DC 4-20mA) and alarm output (relay output) ■Precise diagnostics possible when connected to a portable diagnostic device When connected to the MK-210HEII vibration data management system, precise diagnostics, frequency analysis, and report output are possible ■Power supply compatible with worldwide voltage Can use AC 85-264V power supply, suitable for worldwide use ■For other features and details, please download the catalog. Alternatively, we can provide detailed specifications! Please contact us.

  • Vibration Inspection

Added to bookmarks

Bookmarks list

Bookmark has been removed

Bookmarks list

You can't add any more bookmarks

By registering as a member, you can increase the number of bookmarks you can save and organize them with labels.

Free membership registration

Cross-beam FIB cross-sectional observation

It is possible to observe cross-sections while observing FIB processing in real time.

A new method for structural analysis of electronics products manufactured with nanoscale precision, such as semiconductor devices, MEMS, and TFTs: We propose cross-beam FIB for cross-sectional observation.

  • Contract Analysis
  • Other contract services
  • Electron microscope

Added to bookmarks

Bookmarks list

Bookmark has been removed

Bookmarks list

You can't add any more bookmarks

By registering as a member, you can increase the number of bookmarks you can save and organize them with labels.

Free membership registration

TMA (Thermomechanical Analysis)

Information on thermal expansion, thermal contraction, and glass transition temperature can be obtained in multiple measurement modes!

TMA (Thermomechanical Analysis) is a method that measures the dimensional changes of a sample while applying a constant load and varying the sample temperature. It provides information on thermal expansion, thermal contraction, glass transition temperature, and more. The temperature range is from -150 to 1000°C, with a maximum size of Φ10×25mm (compression mode, needle insertion mode) and a maximum size of 0.7mm×5mm×20mm (tensile mode) as measurable conditions. This document includes case studies of TMA analysis for semiconductor encapsulants. 【Features】 ■ Thermomechanical measurement ■ Applying a constant load to the sample while varying the sample temperature ■ Measuring the dimensional changes of the sample ■ Obtaining information on thermal expansion, thermal contraction, glass transition temperature, etc. ■ Multiple measurement modes *For more details, please refer to the PDF document or feel free to contact us.

  • image_07.png
  • image_08.png
  • image_09.png
  • Contract measurement
  • Contract Analysis
  • Contract Inspection

Added to bookmarks

Bookmarks list

Bookmark has been removed

Bookmarks list

You can't add any more bookmarks

By registering as a member, you can increase the number of bookmarks you can save and organize them with labels.

Free membership registration

EBSD analysis of flexible printed circuits (FPC)

We will introduce EBSD analysis that reveals areas where distortion has accumulated in the wiring of the bending section!

We will introduce the EBSD analysis of flexible printed circuits (FPC). For flexible circuits used in products with movable parts and bending mechanisms, we conducted an EBSD analysis to check for differences in the Cu wiring between the bending section and the fixed section. As a result, while no significant abnormalities or differences were observed in the optical images of the wiring in the bending and fixed sections, the EBSD analysis revealed areas where strain is accumulated in the wiring of the bending section and areas where low-angle grain boundaries are concentrated. [Analysis Content] ■Appearance of the flexible circuit and optical images of Cu wiring - Appearance of the flexible circuit - Wiring in the bending section - Wiring in the fixed section ■Comparison of Cu wiring in the bending section and fixed section using EBSD - Wiring in the bending section - Wiring in the fixed section *For more details, please refer to the PDF document or feel free to contact us.

  • image_02.png
  • image_03.png
  • image_04.png
  • image_05.png
  • Analysis Services
  • Contract Analysis

Added to bookmarks

Bookmarks list

Bookmark has been removed

Bookmarks list

You can't add any more bookmarks

By registering as a member, you can increase the number of bookmarks you can save and organize them with labels.

Free membership registration

State analysis using EPMA

Estimate bonding states by comparing with standard spectra! Introducing state analysis using EPMA.

In the state analysis using EPMA, changes (shifts and shapes) in the characteristic X-ray peak wavelengths due to differences in the chemical bonding states (ionic valence, crystal structure, coordination number) of oxides and silicates are utilized to estimate the bonding states by comparing with standard spectra. In the identification of two types of copper oxides, when distinguishing between black CuO and red Cu2O by color is difficult, especially for microscopic objects that require an electron microscope, it is possible to grasp the oxidation state using EPMA. Additionally, while XPS is effective for measuring thin oxide layers on aluminum surfaces, EPMA can be used to understand the oxidation state of small foreign particles, bulk materials, and composites. 【Device Specifications】 ■ Manufacturer: JEOL Ltd. Jeol-8200 ■ Analysis Method: Wavelength Dispersive X-ray Analysis (WDX) ■ Analyzable Elements: B to U ■ Energy Resolution: 20 eV (EDX is approximately 130 eV) ■ Detection Limit: 0.01% and above ■ Maximum Sample Size: 100x100 mm *For more details, please refer to the PDF document or feel free to contact us.

  • 3.jpg
  • 4.jpg
  • 5.jpg
  • 1.jpg
  • Analysis Services
  • Contract Analysis

Added to bookmarks

Bookmarks list

Bookmark has been removed

Bookmarks list

You can't add any more bookmarks

By registering as a member, you can increase the number of bookmarks you can save and organize them with labels.

Free membership registration

[Data] Cross-sectional observation of solar cell modules

We have published cross-sectional observations of the fracture surface and elemental maps of the fracture area!

This document introduces the cross-sectional observation of solar cell modules. An inspection was conducted on a solar cell module that underwent thermal shock testing, and upon performing a cross-sectional observation of the identified abnormal areas, it was confirmed that the interconnector solder joint had fractured. [Contents] - Cross-sectional observation of the fracture - Element map of the fracture *For more details, please refer to the PDF document or feel free to contact us.

  • Contract Analysis
  • Contract Inspection
  • Contract Analysis

Added to bookmarks

Bookmarks list

Bookmark has been removed

Bookmarks list

You can't add any more bookmarks

By registering as a member, you can increase the number of bookmarks you can save and organize them with labels.

Free membership registration

Reliability testing of materials and chemical analysis evaluation after testing.

Introducing a case where the changes in molecular structure of materials were verified through IR analysis! We also creatively accommodated a variety of sample setups.

Reliability testing of materials that make up the product under thermal and humidity loads is essential, but analysis and evaluation after testing is also an indispensable process. Constant temperature and humidity testing is a device that applies temperature and humidity loads to products and materials to check for changes in physical properties, characteristics, appearance, and lifespan. Our company has also devised various methods for setting up a wide range of samples. In this document, we will introduce a case where changes in the molecular structure of materials before and after constant temperature and humidity testing were verified through IR analysis. We encourage you to read it. [Contents] ■ Examples of reliability testing equipment (constant temperature and humidity testing equipment) ■ Innovations in sample setup ■ Comparative evaluation before and after testing through chemical analysis *For more details, please refer to the PDF document or feel free to contact us.

  • image_02.png
  • image_03.png
  • image_04.png
  • Other contract services

Added to bookmarks

Bookmarks list

Bookmark has been removed

Bookmarks list

You can't add any more bookmarks

By registering as a member, you can increase the number of bookmarks you can save and organize them with labels.

Free membership registration

[Example of TOF-SIMS] Analysis of Li

It is possible to detect with high sensitivity! We will introduce a case comparing the analysis of Li using TOF-SIMS and SEM-EDX.

We will introduce a case comparing the analysis of lithium (Li) using TOF-SIMS and SEM-EDX. While SEM-EDX is used for the analysis of contamination and foreign substances, it is difficult to detect Li with general EDX, excluding windowless EDX. On the other hand, TOF-SIMS can detect Li with high sensitivity. Please feel free to contact us if you need assistance. 【Overview】 ■ Analysis of stains on copper plates ■ SEM-EDX analysis → Difficult to detect Li ■ TOF-SIMS analysis → Li detectable *For more details, please refer to the PDF document or feel free to contact us.

  • tof-sims_Li_2.png
  • Contract measurement

Added to bookmarks

Bookmarks list

Bookmark has been removed

Bookmarks list

You can't add any more bookmarks

By registering as a member, you can increase the number of bookmarks you can save and organize them with labels.

Free membership registration

Analysis of trace metal elements in liquid crystals

Depending on the panel size, it is possible to analyze using different ICP-AES/MS devices!

We will introduce a case where ICP measurement was conducted using panels before and after reliability testing, along with quantification. The liquid crystal molecules in an LCD are oriented within the panel, and the display is controlled by changes in the orientation state of the liquid crystal due to voltage. When ionic substances, such as metal elements, are present inside the panel, the liquid crystal does not operate correctly, leading to display defects. Ionic substances are known to increase due to contamination during manufacturing or long-term use, making it important to quantify and understand them as part of panel quality. Metal ions can be quantitatively analyzed using ICP analysis, and depending on the differences in pretreatment methods and detection sensitivity, ICP-AES and ICP-MS are used selectively. [Analysis Content] ■ Comparison of metal element content using ICP-AES analysis ■ Comparison of metal element content using ICP-MS analysis *For more details, please refer to the PDF document or feel free to contact us.

  • panel_ICP_2.png
  • Analysis Services

Added to bookmarks

Bookmarks list

Bookmark has been removed

Bookmarks list

You can't add any more bookmarks

By registering as a member, you can increase the number of bookmarks you can save and organize them with labels.

Free membership registration

Observation of CMOS image sensor cross-section by mechanical polishing.

Due to the advantages and disadvantages, it is necessary to choose according to the sample form, observation range, purpose, etc.!

At our company, we created a cross-section of the CMOS image sensor component associated with VR goggles manufactured by Company A through mechanical polishing while keeping the component in its original state, and we conducted structural observations of the CMOS sensor component. During the observation of the sensor component structure and sensor surface, we removed the glass filter and observed the surface of the CMOS sensor, where it was noted that the arrangement of the color filters was in a configuration known as a Bayer filter. In addition to mechanical polishing, methods for creating cross-sections include processing with ion beams such as FIB and CP, as well as microtome methods. Consultations are free, so please feel free to contact us if you are unsure about the method for creating cross-sections. [Overview] ■ Observation of sensor component structure and sensor surface ■ Cross-section creation by mechanical polishing ■ SEM observation of the sensor chip surface layer *For more details, please download the PDF or feel free to contact us.

  • Other analysis and evaluation services

Added to bookmarks

Bookmarks list

Bookmark has been removed

Bookmarks list

You can't add any more bookmarks

By registering as a member, you can increase the number of bookmarks you can save and organize them with labels.

Free membership registration