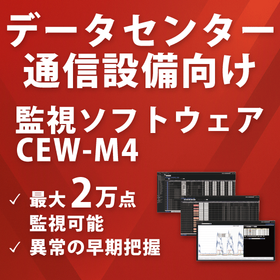
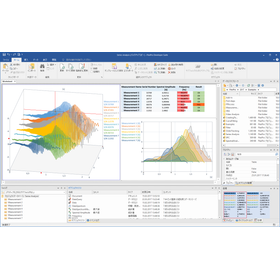
Displays measurement values and alarm statuses on equipment layout diagrams and circuit diagrams. It supports the understanding of equipment and locations where abnormalities occur, as well as the efficiency of on-site verification.
When there are numerous devices and sensors within a factory, simply receiving an alarm may not allow for immediate judgment of the installation location of the target device or the surrounding conditions. Relying solely on the device name or sensor number for verification may require searching for diagrams or inquiring with personnel about the installation location, which can take time before on-site confirmation can occur. By utilizing the map display function of the monitoring software "CEW-M4," measurement values and alarm statuses can be displayed on any image, such as the factory layout, equipment arrangement diagrams, circuit diagrams, and photos of control panels. Since measurement values like current, power, energy, temperature, and humidity can be associated with the actual equipment locations, when an alarm occurs, the target equipment and installation location can be confirmed on the map, which can also help narrow down the equipment or areas that need to be checked on-site.
[Challenges]
Even when an alarm occurs, the installation location of the target equipment is not immediately clear.
It is difficult to grasp the positional relationship with the site relying only on the device name or sensor number.
[Effects of Implementation]
Confirm the alarm-triggering equipment and installation location on the factory layout.
Organize the monitoring screen clearly by associating measurement values with equipment locations.
For more details, please download the PDF document or contact us.