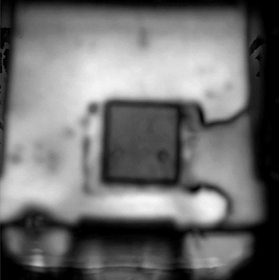
Visualizing the in-plane distribution of impurities such as atmospheric components with a field equivalent to SEM.
SIMS analysis can be applied to various shapes of samples beyond wafers and substrates. In this case study, we will introduce an example of evaluating the distribution of impurities in a wire. The results of evaluating the impurity distribution in the depth direction from the side of the wire (Figure 2) indicate that the impurity profiles of H, O, F, S, and Cl vary in intensity with depth, suggesting that they are localized within the wire. The elemental mapping of the wire cross-section (Figure 3) confirmed the localization of impurities within the wire.
Inquire About This Product
basic information
For detailed data, please refer to the catalog.
Price information
-
Delivery Time
Applications/Examples of results
Trace concentration evaluation and product investigation.
catalog(1)
Download All CatalogsCompany information
MST is a foundation that provides contract analysis services. We possess various analytical instruments such as TEM, SIMS, and XRD to meet your analysis needs. Our knowledgeable sales representatives will propose appropriate analysis plans. We are also available for consultations at your company, of course. We have obtained ISO 9001 and ISO 27001 certifications. Please feel free to consult us for product development, identifying causes of defects, and patent investigations! MST will guide you to solutions for your "troubles"!


![[Analysis Case] Evaluation of Impurities in Metal Wire_C0265](https://image.mono.ipros.com/public/catalog/image/01/9fe/334615/IPROS41028823016794304260.jpeg?w=120&h=170)

![[Analysis Case] Evaluation of Discoloration Causes in Ceramics](https://image.mono.ipros.com/public/product/image/0f5/2001072527/IPROS98951661335687037922.jpeg?w=280&h=280)
![[Analysis Case] Evaluation of the State of the Electrode/Organic Layer Interface in Organic EL Devices](https://image.mono.ipros.com/public/product/image/5e8/2000026122/IPROS8562241420726958415.jpg?w=280&h=280)

![[Analysis Case] Evaluation of Oxidation State of Cu Surface by XPS](https://image.mono.ipros.com/public/product/image/1f8/2000765267/IPROS8938028299443306180.jpg?w=280&h=280)
![[Analysis Case] Evaluation of Composition Distribution in the Active Layer of Organic Thin-Film Solar Cells](https://image.mono.ipros.com/public/product/image/449/2000026103/IPROS85295294008161114941.jpeg?w=280&h=280)


![[Analysis Case Study] Observation of Adhesion State Through Metal Plates Using Ultrasonic Microscopy](https://image.mono.ipros.com/public/product/image/367300/IPROS2705829217984245675.png?w=280&h=280)
