We have compiled a list of manufacturers, distributors, product information, reference prices, and rankings for Analysis software.
ipros is IPROS GMS IPROS One of the largest technical database sites in Japan that collects information on.

Analysis software Product List and Ranking from 288 Manufacturers, Suppliers and Companies | IPROS GMS

Last Updated: Aggregation Period:Jul 22, 2026~Aug 18, 2026
This ranking is based on the number of page views on our site.

Analysis software Manufacturer, Suppliers and Company Rankings

Last Updated: Aggregation Period:Jul 22, 2026~Aug 18, 2026
This ranking is based on the number of page views on our site.

  1. ウェーブフロント 本社 Kanagawa//software
  2. null/null
  3. ミューテック Tokyo//software
  4. 4 BLUE TAG Tokyo//software
  5. 5 日本イーエスアイ Tokyo//software

Analysis software Product ranking

Last Updated: Aggregation Period:Jul 22, 2026~Aug 18, 2026
This ranking is based on the number of page views on our site.

  1. Lighting and optical analysis software "Lighting Simulator CAD" Camerium
  2. Fatigue Life Prediction Analysis Software 'FEMFAT' マグナ・インターナショナル・ジャパン マグナパワートレイン・ECS(Engieering Center Steyr)
  3. Thermal image analysis software "EI-STUDIO" for FLIR thermal cameras. イー・アイ・ソル
  4. 4 Welding analysis software SYSWELD/VisualAssembly 日本イーエスアイ
  5. 5 Network Camera Recording Playback and Image Analysis Software KxViewPro4 ネットカムシステムズ

Analysis software Product List

121~150 item / All 1296 items

Displayed results

Introduction to μ-EXCEL Electrostatic Current Version on 【Analysis Know-How.com】

Estimate heat generation from current density in wiring on printed circuit boards! It's a simple analysis, but there are various themes.

The electrostatic current version calculates the current density within conductors and the resistance between electrodes. It addresses a variety of themes such as thermistors, heating wires, printed circuit boards, and sensor electrodes. For more details, please refer to "163 ex Electrostatic Current Version Introduction" on 【Analysis Know-How.com】. Key points are as follows: - The electrostatic current version checks the current distribution within conductors. - It is a simple analysis, but there are various themes. - For thermistors, it examines the current density between electrodes. - For heating wires in rear glass, it investigates how to ensure an even current flow. - For printed circuit boards, it estimates heat generation from the current density in the wiring. - For sensor electrodes, it estimates the material of the lower layer based on resistance values.

  • Other analyses
  • Analysis software

Added to bookmarks

Bookmarks list

Bookmark has been removed

Bookmarks list

You can't add any more bookmarks

By registering as a member, you can increase the number of bookmarks you can save and organize them with labels.

Free membership registration

Can the resistance value R be determined?

In the electrostatic version, R is calculated from the heat generation energy! In the two-dimensional model, the depth dimension is specified for calculation!

In the electrostatic current version, we calculate the current distribution flowing through the conductor between the electrodes. From the current distribution, we can derive the amount of heat generated, and at the same time, we can also calculate the resistance value R between the electrodes. Once the resistance R is obtained, it can be used for circuit calculations, etc. For more details, please refer to "NO.162 Can the resistance value be determined?" on 【Analysis Know-How.com】. Key points are as follows: - We want to determine the resistance R between electrodes with a complex structure. - It can be calculated from the heat loss energy of the current flowing through the conductor. - In the electrostatic current version, R is calculated from the heat energy. - In a two-dimensional model, the depth dimension is specified for calculation. - If R is determined, it can be used for circuit calculations.

  • Other analyses
  • Analysis software

Added to bookmarks

Bookmarks list

Bookmark has been removed

Bookmarks list

You can't add any more bookmarks

By registering as a member, you can increase the number of bookmarks you can save and organize them with labels.

Free membership registration

【解析ノウハウ.com】ex静電場版の紹介

誘電体・電極で構成、電荷も設定可!キャパシタンスを求める事も出来ます!

静電場版では誘電体と電極による電位・電場分布を求めます、電荷を指定する事も出来ます。キャパシタンスを求める事も出来ます。詳細は【解析ノウハウ.com】の「NO.025 EX静電場版の紹介」をご覧ください ポイントはこちら ・静電場分を見る ・誘電体・電極で構成、電荷も設定可 ・等電位線、電場コンター・電場ベクトル表示 ・電場・電位グラフ出力 ・キャパシタンス算出

  • Other analyses
  • Analysis software

Added to bookmarks

Bookmarks list

Bookmark has been removed

Bookmarks list

You can't add any more bookmarks

By registering as a member, you can increase the number of bookmarks you can save and organize them with labels.

Free membership registration

【解析ノウハウ.com】キャパシタンスは求まるの?

平行平板コンデンサのキャパシタンスCは理論式がある!軸対称モデルも計算できます!

静電場版でキャパシタンスCが算出できます。静電場版では誘電体に蓄えられた電気エネルギーからCを算出しています。任意の形状・複合誘電体のキャパシタンスを求める事が出来ます。詳細は【解析ノウハウ.com】の「NO.142 キャパシタンスは求まるの?」をご覧ください ポイントはこちら ・平行平板コンデンサのキャパシタンスCは理論式がある ・誘電体に蓄えられる全電気エネルギーからも算出できる ・静電場版はエネルギーからCを算出 ・2次元モデルでは奥行き寸法を指定して計算 ・軸対称モデルも計算できる

  • Other analyses
  • Analysis software

Added to bookmarks

Bookmarks list

Bookmark has been removed

Bookmarks list

You can't add any more bookmarks

By registering as a member, you can increase the number of bookmarks you can save and organize them with labels.

Free membership registration

Steady-state thermal analysis sets heat capacity to zero!

In the thermal conduction module, it is possible to calculate the time variation of temperature! If you only want to know the temperature distribution, set the heat capacity to zero for steady-state thermal analysis!

In the heat conduction module, unsteady heat analysis is performed. You can track how the temperature changes over time. If you only want to know the final temperature distribution, you can set the heat capacity to zero and perform steady-state heat analysis. For more details, please refer to "NO.009 Steady-State Heat Analysis Requires Setting Heat Capacity to Zero" on 【Analysis Know-How.com】. Here are the key points: - The heat conduction module allows for the calculation of time-dependent temperature changes (unsteady). - The material properties provided are thermal conductivity and heat capacity. - Thermal conductivity measures how easily heat is transferred, with units of W/mK. - Heat capacity measures how easily temperature increases, with units of J/m³K. - If you only want to see the final temperature, you can perform steady-state calculations. - This can be done by setting the heat capacity to zero. - The heat transfer handbook is recommended.

  • Other analyses
  • Analysis software

Added to bookmarks

Bookmarks list

Bookmark has been removed

Bookmarks list

You can't add any more bookmarks

By registering as a member, you can increase the number of bookmarks you can save and organize them with labels.

Free membership registration

【AnalysisKnowHow.com】Magneto-sputtering analysis available in the trial version!

The key is the magnitude of the X component at the position where the Y component crosses zero! It can be done in about 10 minutes from modeling to result display.

The magnetic field distribution analysis of magnetron sputtering was conducted using an axisymmetric model. From the distribution of the magnetic flux density components on the target, we estimate the erosion. The magnitude of the X component at the position where the Y component crosses zero is crucial. This process can be completed in about 10 minutes, from modeling to result display. Furthermore, it can be done with the free trial version of the static magnetic field! Please give it a try. For more details, please refer to NO.020 on "Analysis Know-How.com." You can download the trial version from the sample software on the special site below: https://premium.ipros.jp/mutec/product/detail/2000623620/?hub=148+2991245

  • Other analyses
  • Analysis software

Added to bookmarks

Bookmarks list

Bookmark has been removed

Bookmarks list

You can't add any more bookmarks

By registering as a member, you can increase the number of bookmarks you can save and organize them with labels.

Free membership registration

How to specify flow rate with an equivalent heat transfer coefficient!

Specify the flow rate of the cooling pipe in temperature analysis with an equivalent heat transfer coefficient! The calculation formula has been organized!

There are times when we evaluate the effect of cooling pipes through temperature analysis. Originally, this calculation requires a high-level analysis function known as "thermal fluid analysis." If such precision is not required, I would like to evaluate it simply using approximate calculations. Therefore, I have considered a method to approximate the flow velocity of the cooling pipes with an equivalent heat transfer coefficient. I have organized the formulas for calculating the heat transfer coefficient of cooling pipes from the literature, and by providing the flow velocity, I can calculate the equivalent heat transfer coefficient. The outlet temperature can also be estimated. Please refer to No. 015 on "Analysis Know-How.com."

  • Other analyses
  • Analysis software

Added to bookmarks

Bookmarks list

Bookmark has been removed

Bookmarks list

You can't add any more bookmarks

By registering as a member, you can increase the number of bookmarks you can save and organize them with labels.

Free membership registration

【Analysis Know-How.com】Electromagnetism is difficult, so I took a quick look!

You can feel like you understand something a little without taking much time! Please take a look during your spare moments!

MUTECH is a company that provides simulation services centered around electromagnetism. However, for many engineers, electromagnetism can be a challenging topic. What are Maxwell's equations? Divergence, rotation, and vector operations are all so confusing! So, first, we took a rough look at it; this way, you can feel like you understand something without spending too much time. Please take your time to learn more thoroughly along this point! On the analysis know-how website, we have uploaded a video titled "Into the World of Electromagnetic Simulation." Please take a look during your spare time! Additionally, MUTECH offers: - Professional consulting that delves into our clients' issues - Affordable contract analysis and custom development services.

  • Other analyses
  • Analysis software

Added to bookmarks

Bookmarks list

Bookmark has been removed

Bookmarks list

You can't add any more bookmarks

By registering as a member, you can increase the number of bookmarks you can save and organize them with labels.

Free membership registration

[Analysis Know-How.com] μ-EXCEL Analysis Know-How Video Site Launched

The video contains compact content of about 1 to 2 minutes! You can easily check the topics you want to know using your smartphone or other devices.

"Analysis Know-How.com" is a website that collects videos introducing the benefits of the analysis software μ-EXCEL, provided by Mutech, which is easy, fast, and suitable for initial assessments, along with analysis know-how. The videos are compact, lasting about 1 to 2 minutes, and allow for filtered searches by keywords and categories. You can easily check the items you want to know using your smartphone during your spare time. On the "Home" menu, you can find a list of know-how collections. By clicking the "View Details" button, you can view the key points of the know-how and the videos. In the "Category" menu, you can narrow down by genre or series. The "Keyword Search" allows you to further refine related videos. In the "Blog," we will introduce updated and additional videos as they become available. μ-EXCEL is available as a subscription service for 9,800 yen per month (excluding tax). Additionally, we offer: - Professional consulting that delves into your issues. - Contract analysis and custom development at affordable prices. For more details, please feel free to contact us.

  • Other analyses
  • Analysis software

Added to bookmarks

Bookmarks list

Bookmark has been removed

Bookmarks list

You can't add any more bookmarks

By registering as a member, you can increase the number of bookmarks you can save and organize them with labels.

Free membership registration

Electromagnetic Field Analysis Software 【μ-EXCEL Magnetization Torque Version】

"Excel-based simulation software" Check out the operation feel in the video now! Free trial download is also available!

"μ-Excel" is a low-cost thermal, structural, and electromagnetic analysis software that overturns the common belief that analysis software is expensive. It operates on Excel, allowing for professional simulations with a familiar user experience. You can check the operation feel through videos for each work step! The video available here is "Step 10 Surface Magnetic Flux Calculation" - taking the "Magnetization Torque Version" of the "μ-Excel" series as an example, we will introduce the flow of evaluating the surface magnetic flux created by the magnetized magnets unique to the magnetization torque version. ▽▼▽ Please also check out other videos! ▼▽▼ Step 0 Introduction Step 1 Starting Excel Step 2 Model Creation Step 3 DXF Import Step 4 Mesh Creation Step 5 Execute Calculation Step 6 Add Materials Step 7 Display Results Step 8 Create Graphs Step 9 Save As ▼Step 10 Surface Magnetic Flux Calculation Step 11 Torque Calculation

  • Magnetic field analysis/electromagnetic wave analysis
  • Analysis software

Added to bookmarks

Bookmarks list

Bookmark has been removed

Bookmarks list

You can't add any more bookmarks

By registering as a member, you can increase the number of bookmarks you can save and organize them with labels.

Free membership registration

Introduction to Desktop Structural Analysis Program

Creating geometry and analysis models, executing analyses, and post-processing, all realized in one software!!

【Features】 ○ A structural analysis solution that combines the pre- and post-processor "Simcenter Femap" with the analysis solver "Simcenter Nastran." ○ The entire process of creating analysis models, performing analyses, and displaying results from shape data created in 3D-CAD is realized in one software on a single PC. ○ High operability. ○ Easy to implement pricing. ◎ For more detailed information, please refer to the catalog or contact us directly.

  • Structural Analysis
  • Analysis software

Added to bookmarks

Bookmarks list

Bookmark has been removed

Bookmarks list

You can't add any more bookmarks

By registering as a member, you can increase the number of bookmarks you can save and organize them with labels.

Free membership registration

Case study: Hull strength analysis using the finite element method.

A full hull model close to the actual structure was created, and strength analysis of the model was conducted.

**Case Summary** ■Product Name: Simcenter Femap with Nastran ■Analysis: Linear Static Analysis ■Industry: Railways and Shipping Finite element method strength calculations are widely used in hull design. The hull structure, composed of many components such as decks, side plating, double bottoms, bulkheads, and longitudinal and transverse strength frames, is complex, making it difficult to analyze just a part of it. This example created a full model close to the actual structure and conducted a strength analysis of the entire hull model. - The mesh generation feature of Simcenter Femap allows for the creation of complex hull FEM models. - Creation and management of loads such as static/dynamic water pressure and cargo conditions. - Improved computational efficiency through continuous analysis of multiple load cases. - The parallel processing capability of Simcenter Nastran enables analysis of large-scale models. □ For other features and details, please refer to the catalog.

  • Other analyses
  • Analysis software

Added to bookmarks

Bookmarks list

Bookmark has been removed

Bookmarks list

You can't add any more bookmarks

By registering as a member, you can increase the number of bookmarks you can save and organize them with labels.

Free membership registration

[Example] Rotor Dynamics

Introducing the rotational system analysis capabilities of Simcenter Nastran!!!

**Case Overview** ■Product Name: Simcenter Nastran ■Analysis: Eigenvalue analysis, linear transient analysis, frequency response analysis ■Industry: Mechanical components Stable operation is extremely important for various rotating machinery such as turbines, jet engines, generators, fluid equipment, and electric products, and vibration prevention is an essential challenge. In this example, we will introduce the rotating system analysis capabilities of Simcenter Nastran using a representative model of rotor dynamics. □ For other features and details, please refer to the catalog.

  • Other analyses
  • Analysis software

Added to bookmarks

Bookmarks list

Bookmark has been removed

Bookmarks list

You can't add any more bookmarks

By registering as a member, you can increase the number of bookmarks you can save and organize them with labels.

Free membership registration

[Example] Rotating Dynamics Eigenvalue Analysis

We conducted a modal complex eigenvalue analysis at the specified rotation speeds to investigate the whirling modes due to rotation, changes in damping, and critical speeds.

**Case Overview** ■Product Name: Simcenter Nastran ■Analysis: Modal Analysis of Natural Frequencies ■Industry: Other The vibration characteristics of rotating bodies exhibit whirl motion due to centrifugal force, tilt vibrations, and gyroscopic effects as the axis rotates, resulting in changes in eigenvalues. When the direction of rotation and whirl motion align, it is referred to as forward whirl; when they are opposite, it is called backward whirl. When the rotational speed matches the eigenvalue of the axis, the amplitude of the whirl increases, leading to instability in the rotating system and potential damage to components. The speed at this point is referred to as the critical speed. In this analysis, modal complex eigenvalue analysis was conducted for specified rotational speeds to investigate the whirl modes induced by rotation, changes in damping, and critical speeds. □ For other functions and details, please refer to the catalog.

  • Other analyses
  • Analysis software

Added to bookmarks

Bookmarks list

Bookmark has been removed

Bookmarks list

You can't add any more bookmarks

By registering as a member, you can increase the number of bookmarks you can save and organize them with labels.

Free membership registration

Rotating body and bearing coupled analysis software 'MADYN2000'

We lead in the analysis of rotating bodies using specialized software for fluid film bearings, magnetic bearings, and coupled analysis with bearings, as well as optimization CAE analysis techniques.

MADYN2000 is a finite element software developed by experts in bearings for coupled analysis of rotating bodies and bearings. It allows for smooth performance analysis of rotating bodies, optimization analysis of various parameters of bearings, and coupled analysis with active magnetic bearings and their PID control systems. The calculation of support stiffness for rolling bearings uses software and libraries from Swiss company MESYS AG. 【Features】 ⇒ User-friendly with a sophisticated interface. ⇒ Easy model creation with copy and paste functions for input data. ⇒ Smooth unit selection and conversion with unit assistance features. ⇒ Developed on the MATLAB platform, facilitating collaboration with experimental data processing. Executable analysis functions (rotating bodies: lateral and torsional vibrations) - Support load analysis - Complex eigenvalue analysis at rated speed - Frequency response and unbalance analysis - Transient response and speed-up analysis - Parameter variable analysis → Campbell diagram → Critical speed map → Sensitivity analysis of support stiffness and dampers → Sensitivity analysis of coupling stiffness

  • others
  • Analysis software

Added to bookmarks

Bookmarks list

Bookmark has been removed

Bookmarks list

You can't add any more bookmarks

By registering as a member, you can increase the number of bookmarks you can save and organize them with labels.

Free membership registration

[Example] Vibration of liquid tanks and sloshing of the liquid surface during an earthquake.

Case study using seismic waves from the Great East Japan Earthquake!!

**Case Overview** ■Product Name: Simcenter Fema with Nastran ■Industry: Construction There are many structural forms for containers that store liquids and their supports. During an earthquake, the sloshing of the liquid surface inside the tank generates dynamic liquid pressure that acts on the container's side walls and bottom plate, leading to tank damage and rocking vibrations that can cause parts of the bottom plate to lift, resulting in tank damage. This case study utilized the virtual fluid boundary and phantom elements of Simcenter Nastran to perform transient response analysis on three types of tanks, as shown in the right diagram, using the seismic waves from the 2011 Great East Japan Earthquake (M9). Below, we present the sloshing behavior and dynamic liquid pressure distribution during the earthquake. * Downloaded from K-NET For more detailed information, please refer to the catalog or contact us directly.

  • Other analyses
  • Analysis software

Added to bookmarks

Bookmarks list

Bookmark has been removed

Bookmarks list

You can't add any more bookmarks

By registering as a member, you can increase the number of bookmarks you can save and organize them with labels.

Free membership registration

[Example] External Super Element

Reduction of analysis costs, enhancement of information security!!!

【Case Overview】 ■Product Name: Simcenter Femap with Nastran There has been an image that Super Elements (SE) are only applicable in the aerospace and automotive fields and can only be used by a few dedicated analysts. There has been no pre-post that fully supports SE analysis, and the data creation process has been complicated, which has hindered its widespread adoption until now. Simcenter Femap supports external Super Elements from Simcenter Nastran, making SE analysis accessible to everyone.

  • Other analyses
  • Analysis software

Added to bookmarks

Bookmarks list

Bookmark has been removed

Bookmarks list

You can't add any more bookmarks

By registering as a member, you can increase the number of bookmarks you can save and organize them with labels.

Free membership registration

Introduction to multiphysics fluid analysis software!

You can perform everything from geometry creation using CAD functions to evaluation of analysis results in a single package!

"Simcenter STAR-CCM+" is a general-purpose thermal fluid analysis software that can manage data in a single file. Since it is an integrated environment, automating work processes such as computation execution and result evaluation is easy. With its rich physical models and features, it can analyze various phenomena in a complex manner. [Features] ■ Integrated environment ■ Automatable workflow ■ Flexible and highly robust modeling capabilities ■ Comprehensive multiphysics ■ Abundant physical models *For more details, please download the PDF or feel free to contact us.

  • Software (middle, driver, security, etc.)
  • Analysis software

Added to bookmarks

Bookmarks list

Bookmark has been removed

Bookmarks list

You can't add any more bookmarks

By registering as a member, you can increase the number of bookmarks you can save and organize them with labels.

Free membership registration

Analysis of the acoustic characteristics of truck cabins.

A case study of modeling the vehicle body structure and the acoustic space inside the cabin, and conducting coupled frequency response analysis.

We would like to introduce our analysis of "Cabin Acoustic Characteristics of Tracks Using Acoustic Coupled Analysis Function." In recent years, considering low noise environments has become very important. It is effective to use finite element method analysis to understand the acoustic characteristics of the cabin during the design phase and to reduce noise transmission to the operator through structural considerations. In this case, we used the Simcenter Nastran structural-acoustic coupled analysis function to model the vehicle body structure and the acoustic space within the cabin, conducting a coupled frequency response analysis to determine the acoustic transmission characteristics from the vehicle body mounting points to the operator's ear position. 【Case Overview】 ■ Function Used: Simcenter Nastran Structural-Acoustic Coupled Analysis Function ■ Analysis Content - Model the vehicle body structure and the acoustic space within the cabin - Conduct coupled frequency response analysis - Determine the acoustic transmission characteristics from the vehicle body mounting points to the operator's ear position *Detailed information about the case can be viewed through the related links. For more details, please feel free to contact us.

  • Contract Analysis
  • Analysis software

Added to bookmarks

Bookmarks list

Bookmark has been removed

Bookmarks list

You can't add any more bookmarks

By registering as a member, you can increase the number of bookmarks you can save and organize them with labels.

Free membership registration

Integrated Multiphysics Analysis Software

Equipped with high-end meshing technology!

Our company offers "integrated multiphysics analysis software." It enables everything from shape creation using CAD to evaluation of calculation results in one package. All data is managed in a single file. Additionally, it allows for simultaneous analysis of multiple physical phenomena. It is suitable for cases where you want to add analysis to thermal fluid analysis. 【Features】 ■Integrated Environment - Achieves everything from shape creation using CAD to evaluation of calculation results in one package - Manages all data in a single file ■Multiphysics Support - Allows simultaneous analysis of multiple physical phenomena - Suitable for cases where you want to add analysis to thermal fluid analysis *For more details, please download the PDF or feel free to contact us.

  • Other CAD related software
  • Analysis software

Added to bookmarks

Bookmarks list

Bookmark has been removed

Bookmarks list

You can't add any more bookmarks

By registering as a member, you can increase the number of bookmarks you can save and organize them with labels.

Free membership registration

Technical Information Magazine WAZA Vol.33

Challenges in Fluid Analysis in Composite Fields! Introducing Analysis Solvers with Examples.

"WAZA Vol.33" introduces the numerical fluid analysis (CFD) solver "STAR-CCM+" that our company has implemented, along with various case studies. It features the "analysis solver STAR-CCM+", "fluid analysis case studies," and "manufacturing reform through 1DCAE," among other topics. [Contents] ■ Introduction to the analysis solver STAR-CCM+ ■ Fluid analysis case studies ■ Manufacturing reform through 1DCAE ■ Customer's Interview *For more details, please refer to the catalog or feel free to contact us.

  • Thermo-fluid analysis
  • Analysis software

Added to bookmarks

Bookmarks list

Bookmark has been removed

Bookmarks list

You can't add any more bookmarks

By registering as a member, you can increase the number of bookmarks you can save and organize them with labels.

Free membership registration

[Video Now Available!] Wireless Vibration Acceleration Sensor for Motors / Analysis Software

A vibration meter capable of real-time data display through high-speed wireless sampling and automatic creation of trend graphs, making it easy to perform preventive maintenance on equipment!

The high-speed 3-channel compact wireless vibration recorder 'MVP-RF3-HC' is a wireless 3-axis (3ch) vibration recorder capable of real-time data display with high-speed sampling at 4kHz. By combining it with the piezoelectric 3-axis accelerometer 'MA3 series', it enables high-frequency vibration measurement of up to 10kHz. The vibration data automatic analysis software 'MVP-VCS-S' automatically calculates the effective values (RMS values) of vibration acceleration and velocity, creates trend graphs, and allows for automatic trend management. Additionally, by setting thresholds, it can also determine abnormalities, making it ideal for the 'predictive maintenance' of motors. 【Features】 1. High-speed sampling of 10kHz for 1ch and 4kHz for 3ch is possible. 2. In combination with the piezoelectric 3-axis accelerometer, it allows measurement over a wide range: - Vibration frequency up to 10kHz - Vibration acceleration up to 1000G 3. Data can be displayed in real-time. 4. Data can be saved as a CSV file. 5. Bluetooth is used for wireless communication, allowing communication up to approximately 30m. 6. The vibration data automatic analysis software enables automatic generation of trend graphs.

  • Vibration Testing
  • Analysis software

Added to bookmarks

Bookmarks list

Bookmark has been removed

Bookmarks list

You can't add any more bookmarks

By registering as a member, you can increase the number of bookmarks you can save and organize them with labels.

Free membership registration

Real-time analysis software Creo Simulation Live

This is software that enables real-time simulation on the 3D CAD software "Creo," which designers are accustomed to using.

Designers can instantly check analysis results themselves, significantly reducing work time. By implementing Creo Simulation Live, real-time simulations can be performed based on CAD data, allowing designers to immediately verify analysis results on the spot. This virtually eliminates waiting time for analysis and greatly shortens the iteration time between design and analysis in the basic design phase.

  • Structural Analysis
  • Other CAD related software
  • simulator
  • Analysis software

Added to bookmarks

Bookmarks list

Bookmark has been removed

Bookmarks list

You can't add any more bookmarks

By registering as a member, you can increase the number of bookmarks you can save and organize them with labels.

Free membership registration

Multivariate Data Visualization and Analysis Tool BIGDAT@Analysis

Visualization and analysis of big data with simple operations, without the need for specialized knowledge such as statistical analysis or multivariate analysis.

■ Benefits of Implementation 1) Data analysis by on-site experts By having experts conduct the analysis themselves, new discoveries can be made without overlooking unexpected correlations in the attributes. 2) Accelerating multivariate data analysis through visualization By visualizing the data, it becomes possible to grasp the nature of big data from a broader perspective, identify the need for preprocessing, understand the difficulty of analysis, and easily conduct multivariate data analysis along with the necessary statistical analysis processes. 3) Utilizing multivariate analysis for defect factor analysis, discovery of optimal values, and anomaly detection Multivariate analysis can be used to identify defect factors and improve yield rates, enhance performance through the discovery of favorable condition parameters, and even if complete analysis is not possible, anomaly detection can be performed by comparing with past states.

  • Business Intelligence and Data Analysis
  • Analysis software

Added to bookmarks

Bookmarks list

Bookmark has been removed

Bookmarks list

You can't add any more bookmarks

By registering as a member, you can increase the number of bookmarks you can save and organize them with labels.

Free membership registration

JMP Pro

Sophisticated methods for conducting advanced analysis.

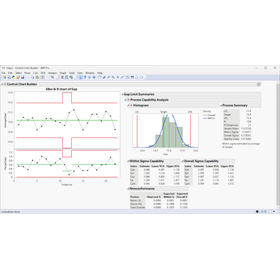
JMP Pro is software that adds advanced analytical capabilities to JMP. The statistical analysis software JMP Pro, provided by SAS, is designed for scientists and engineers and includes familiar excellent features such as visual data access, data manipulation, interactive operation methods, a wealth of analytical functions, and scalability, along with numerous advanced techniques. Furthermore, JMP Pro offers a variety of advanced tools. It includes predictive modeling with validation features using various different methods, state-of-the-art modeling techniques, model comparison and averaging, advanced multivariate analysis, reliability block diagrams, coverage arrays, mixed models, uplift models, and statistical methods utilizing advanced calculators. With JMP Pro, you can perform sophisticated and diverse analyses, helping to remove barriers that hinder statistical discoveries and uncover clues hidden in the data. This enables you to more quickly find breakthroughs in problems and anticipate and control the future.

  • Business Intelligence and Data Analysis
  • Process Control System
  • Production Management System
  • Analysis software

Added to bookmarks

Bookmarks list

Bookmark has been removed

Bookmarks list

You can't add any more bookmarks

By registering as a member, you can increase the number of bookmarks you can save and organize them with labels.

Free membership registration

Statistical Analysis Software JMP Free Trial Seminar (6/10)

To researchers and technology developers in the manufacturing industry, as well as manufacturing and quality control managers. If you feel the limitations of Excel, start with this seminar.

This is a free seminar on JMP aimed at engineers in the manufacturing industry who understand the need for data analysis but lack available tools, and those who want to utilize statistics but cannot write code. Participants can comfortably join the online format by operating JMP on their own while watching the instructor's demo, making it suitable for beginners. 【Overview】 JMP is utilized across various industries and job types, with users coming from diverse backgrounds. The "Getting Started: JMP Experience Seminar" is structured to help participants understand JMP's usability and rich features, regardless of their industry, job type, or background. 【Recommended for】 - Those who recognize the necessity of data analysis but are troubled by the absence of optimal tools. - Those who want to verify whether members of their department can effectively use JMP. - Those who are familiar with the name JMP but do not know what kind of tool it is. For those who do not have JMP, participation is possible using a 30-day free trial version. Trial: https://www.jmp.com/ja/download-jmp-free-trial

  • Business Intelligence and Data Analysis
  • Technical Seminar
  • Analysis software

Added to bookmarks

Bookmarks list

Bookmark has been removed

Bookmarks list

You can't add any more bookmarks

By registering as a member, you can increase the number of bookmarks you can save and organize them with labels.

Free membership registration

Bayesian Optimization with the Statistical Analysis Software JMP Pro

Hands-on workshop for manufacturing researchers and engineers: Bayesian optimization using the statistical analysis software JMP Pro conducted with no code.

Bayesian optimization is gaining attention as a method for efficiently developing new products and processes. It is characterized by its ability to efficiently explore optimal conditions through sequential experiments. In this seminar, we will introduce the Bayesian optimization platform included in JMP Pro 19, explain its basic concepts, and then provide hands-on experience with the software. 【Target Audience】 - Individuals involved in product and process development in the manufacturing industry - Those who conduct experiments in their work - Individuals considering or interested in utilizing Bayesian optimization 【Overview】 - Introduction / Overview of Bayesian Optimization - Basic concepts and application scenarios - Operation explanation using JMP Pro 19 - Hands-on session (condition exploration using simulation examples) - Summary and Q&A Participants are requested to bring their own laptops and will operate JMP Pro using a virtual environment (virtual lab). For details on system requirements, please check the application page below. https://www.jmp.com/ja/events/seminars/non-series/2026/09-01-bayes

  • Technical Seminar
  • Statistical analysis
  • Other production and development software and systems
  • Analysis software

Added to bookmarks

Bookmarks list

Bookmark has been removed

Bookmarks list

You can't add any more bookmarks

By registering as a member, you can increase the number of bookmarks you can save and organize them with labels.

Free membership registration

Statistical Analysis Software JMP Basic Seminar on Experimental Design

For researchers and technology developers in the manufacturing industry! Experiment Design (DOE) that can be started with no code.

This is an introductory seminar to learn the basic operations of JMP's "Design of Experiments (DOE)." Anyone can participate, regardless of industry, job type, or experience with design of experiments. You will be able to experience the basic operations and functions of design of experiments while actually operating JMP on your own device, following the instructor's explanations and the provided text (PDF version). [Content] The seminar will focus on explaining the procedures for creating experimental designs, entering experimental data, fitting models, and visualizing results (such as contour plots and response surfaces) using JMP. JMP's "Custom Design" is a flexible experimental design creation feature that accommodates screening experiments and optimization experiments. It allows for the combination of various types of factors, such as continuous factors, categorical factors, and mixture factors, and can also create experimental designs with constraints on factors. In this seminar, we will introduce these features and how to utilize them while actually creating experimental designs using "Custom Design." If you do not have JMP, you can participate using a 30-day free trial version. Trial: https://www.jmp.com/ja/download-jmp-free-trial

  • Technical Seminar
  • Statistical analysis
  • Analysis software

Added to bookmarks

Bookmarks list

Bookmark has been removed

Bookmarks list

You can't add any more bookmarks

By registering as a member, you can increase the number of bookmarks you can save and organize them with labels.

Free membership registration

3D general-purpose thermal fluid analysis software "PHOENICS"

Pioneer of thermal fluid analysis software. Thermal fluid analysis software that anyone can use! Implementation is possible at a cost of several hundred thousand yen!

● The thermal fluid analysis software "PHOENICS" is equipped with pre-processing, post-processing, and solver programs as standard (※). (※) The basic flow of PHOENICS: Setting analysis conditions ⇒ Modeling ⇒ Running analysis ⇒ Processing results ● It allows for pre-processing such as shape definition, data import from CAD, mesh creation, and setting analysis conditions, as well as post-processing for displaying results like temperature distribution maps, pressure contours, and velocity vectors after analysis. ● PHOENICS incorporates initial values, physical property values, boundary conditions, and many other functions, but users can customize PHOENICS themselves and create their own dedicated calculation modules. ● Therefore, it is a versatile thermal fluid analysis software designed with ease of use in mind, suitable for a wide range of users from beginners to advanced users. ● With PHOENICS, it is possible to implement it for several hundred thousand yen. For more information on other features and characteristics, please contact us.

  • Contract Analysis
  • Thermo-fluid analysis
  • Analysis software

Added to bookmarks

Bookmarks list

Bookmark has been removed

Bookmarks list

You can't add any more bookmarks

By registering as a member, you can increase the number of bookmarks you can save and organize them with labels.

Free membership registration

Real-time data collection and analysis software

Real-time data collection! Significant effects on CO2 countermeasures and efforts to reduce power consumption in production facilities.

We handle the "Real-Time Data Collection and Analysis Software" for the Yokogawa Electric Corporation's Data Acquisition & Control System "SMARTDAC+ Series." It is possible to connect the Yokogawa Electric Corporation's Data Acquisition & Control System "SMARTDAC+ Series" to a computer and collect data in real-time. This software is highly effective in the comprehensive evaluation of new energy systems such as solar and wind power generation, as well as in efforts to reduce CO2 emissions and power consumption in production facilities, which are being strengthened year by year under energy conservation laws and Energy Star programs. 【Features】 ■ Widely usable for the development and testing of new energy products ■ Can connect up to 20 units and 1200 channels ■ Real-time measurement possible in as short as 100 ms ■ Easy monitoring of the status of each production line and experimental equipment installed in remote locations ■ Measurement and configuration of measuring instruments can be done solely with this software ■ Custom modifications are available for cases requiring different processing for each customer at an additional cost *For more details, please refer to the PDF document or feel free to contact us.

  • Other information systems
  • Analysis software

Added to bookmarks

Bookmarks list

Bookmark has been removed

Bookmarks list

You can't add any more bookmarks

By registering as a member, you can increase the number of bookmarks you can save and organize them with labels.

Free membership registration