We have compiled a list of manufacturers, distributors, product information, reference prices, and rankings for soft.
ipros is IPROS GMS IPROS One of the largest technical database sites in Japan that collects information on.

soft(log) - List of Manufacturers, Suppliers, Companies and Products | IPROS GMS

Last Updated: Aggregation Period:Jul 29, 2026~Aug 25, 2026
This ranking is based on the number of page views on our site.

soft Product List

271~300 item / All 362 items

Displayed results

I want to verify the effects of introducing xOpt in advance.

A service that visualizes and provides simulation results such as effectiveness verification during the introduction of material handling equipment and analysis of the current situation!

Our service "LogiUp" solves the challenge of wanting to verify the effectiveness of implementing the Transit Optimal Platform/xOpt in advance. To visualize the factory with beautiful 3D models, the results from LogiUp can also be used as presentation materials for exhibitions and customer acquisition. This service does not require customers to purchase simulation tools or learn how to operate them. 【Recommended for companies like these】 ■ Have introduced AGVs for the first time but are experiencing congestion and want to know efficient operation methods ■ AGV operating costs are high, and want to reduce the number of AGVs as much as possible ■ Considering multiple AGVs but unsure which AGV specifications are optimal ■ Want to evaluate the impact when changing the layout of storage areas, material handling equipment, and flow lines within the factory ■ Want to convey the implementation image to customers when proposing material handling equipment *For more details, please refer to the related links or feel free to contact us.

  • Company:iPX
  • Price:Other
  • Virtual Reality Related
  • soft

Added to bookmarks

Bookmarks list

Bookmark has been removed

Bookmarks list

You can't add any more bookmarks

By registering as a member, you can increase the number of bookmarks you can save and organize them with labels.

Free membership registration

I want to evaluate the impact of changing the layout within the factory.

It is now possible to optimize individual routes for AGVs, allowing for more efficient operation of factories and warehouses!

Our "LogiUp" service addresses the challenges of evaluating the impact when changing the layout of storage areas, material handling equipment, and flow within factories. Customers only need to provide the data necessary for the simulation, after which we will execute the simulation and deliver the results as a report and video. Additionally, to visualize the factory with beautiful 3D models, the results from LogiUp can also be used as presentation materials for exhibitions and customer acquisition. [Recommended for companies like these] ■ Have introduced AGVs for the first time but are experiencing congestion and want to know efficient operational methods. ■ AGV operating costs are high, and want to reduce the number of AGVs as much as possible. ■ Considering multiple AGVs but unsure which AGV specifications are optimal. ■ Want to verify the effects of implementing Transit Optimal Platform/xOpt in advance. ■ Want to convey the implementation image to customers when proposing material handling equipment. *For more details, please refer to the related links or feel free to contact us.

  • Company:iPX
  • Price:Other
  • Virtual Reality Related
  • soft

Added to bookmarks

Bookmarks list

Bookmark has been removed

Bookmarks list

You can't add any more bookmarks

By registering as a member, you can increase the number of bookmarks you can save and organize them with labels.

Free membership registration

[Problem Solving] When proposing equipment, I want to convey the implementation image to the customer.

You can also use the results of LogiUp as presentation materials for exhibitions and customer acquisition!

Our service "LogiUp" solves the challenge of wanting to convey the implementation image of material handling equipment to customers. We recreate the layout and operational status of your factory or warehouse in a virtual environment, providing visualized simulation results for effect verification and current analysis when introducing material handling equipment. This service does not require customers to purchase simulation tools or learn how to operate them. [Recommended for companies like these] ■ Have introduced AGVs for the first time but are experiencing congestion and want to know efficient operation methods. ■ AGV operating costs are high, and want to reduce the number of AGVs as much as possible. ■ Considering multiple AGVs but unsure which AGV specifications are optimal. ■ Want to evaluate the impact of changes to the layout of storage areas, material handling equipment, and pathways within the factory. ■ Want to verify the effects of implementing Transit Optimal Platform/xOpt in advance. *For more details, please refer to the related links or feel free to contact us.

  • Company:iPX
  • Price:Other
  • Virtual Reality Related
  • soft

Added to bookmarks

Bookmarks list

Bookmark has been removed

Bookmarks list

You can't add any more bookmarks

By registering as a member, you can increase the number of bookmarks you can save and organize them with labels.

Free membership registration

Specialized graph creation software for geology, "SigmaPlot."

Research results in stratigraphic analysis expressed more clearly.

In the field of geology, particularly in stratigraphic analysis, it is essential to accurately visualize the complex structures and data of strata and to express the analysis results clearly. Accurately graphing information such as the depth of strata, types of rocks, and ages, and sharing it in papers and reports is important for enhancing the quality of research. Inappropriate graphical representations can lead to misunderstandings of the data and undermine the reliability of the analysis results. SigmaPlot, as a specialized graphing software focused on science and technology, provides a wealth of features to accurately represent geological research findings. 【Usage Scenarios】 - Creation of stratigraphic cross-sections - Creation of bar charts - Creation of geological maps - Analysis of drilling data - Visualization of sedimentary structures 【Benefits of Implementation】 - Easier visual understanding of the structure and characteristics of strata - Ability to express complex data clearly - Improved quality of papers and presentation materials - Increased efficiency in data analysis Basic Operations of SigmaPlot (link to Hulinks page) https://www.hulinks.co.jp/software/sigmaplot/sigmaplot_bso_guide/

  • SigmaPlot_butterflyplot.png
  • SigmaPlot_confidencebands1.png
  • SigmaPlot_violinplot.png
  • Software (middle, driver, security, etc.)
  • Graph Analysis
  • Statistical analysis
  • soft

Added to bookmarks

Bookmarks list

Bookmark has been removed

Bookmarks list

You can't add any more bookmarks

By registering as a member, you can increase the number of bookmarks you can save and organize them with labels.

Free membership registration

Specialized Graph Creation for Medical and Clinical Research: SigmaPlot

Clearly create graphs of research results in case comparison.

In the field of medicine and clinical research, particularly in case comparisons, it is essential to accurately compare multiple case data and present the results in an easily understandable manner. To enhance the reliability of research findings and ensure successful publication and conference presentations, visual representations that capture the characteristics of the data are indispensable. Inappropriate graphical representations may fail to convey the meaning of the data adequately, potentially undermining the value of the research. SigmaPlot has been designed as a specialized graphing software tailored to meet the needs of such researchers in the field of science and technology. 【Usage Scenarios】 - Creating graphs to compare data from multiple case groups - Visualizing the results of clinical trials - Preparing figures and tables for papers and conference presentations 【Effects of Implementation】 - Clearly visualizing differences between cases - Enhancing the persuasiveness of research results - Reducing time through efficient data analysis and graph creation

  • SigmaPlot_butterflyplot.png
  • SigmaPlot_confidencebands1.png
  • SigmaPlot_violinplot.png
  • Software (middle, driver, security, etc.)
  • Graph Analysis
  • Statistical analysis
  • soft

Added to bookmarks

Bookmarks list

Bookmark has been removed

Bookmarks list

You can't add any more bookmarks

By registering as a member, you can increase the number of bookmarks you can save and organize them with labels.

Free membership registration

Specialized Graph Creation for Engineering (Mechanical and Electrical) - 'SigmaPlot'

Data analysis and graph creation tools to support performance verification.

In the field of engineering (mechanical and electrical), accurately and clearly visualizing experimental data and simulation results is essential for identifying issues and considering improvement measures. In particular, specialized graphing capabilities are required to read trends from complex datasets and provide objective evidence. Inadequate graph representations can lead to incorrect analyses and decision-making. SigmaPlot, as a specialized graphing software focused on science and technology, supports the accurate representation of research results. 【Usage Scenarios】 - Graphing experimental data - Visualizing simulation results - Creating performance evaluation reports - Preparing technical presentation materials 【Benefits of Implementation】 - Objective performance evaluation based on data - Early detection of issues and promotion of improvement measures - Clear information sharing with stakeholders - Increased efficiency in research and development Basic Operations of SigmaPlot (link to Hulinks page) https://www.hulinks.co.jp/software/sigmaplot/sigmaplot_bso_guide/

  • SigmaPlot_butterflyplot.png
  • SigmaPlot_confidencebands1.png
  • SigmaPlot_violinplot.png
  • Software (middle, driver, security, etc.)
  • Graph Analysis
  • Statistical analysis
  • soft

Added to bookmarks

Bookmarks list

Bookmark has been removed

Bookmarks list

You can't add any more bookmarks

By registering as a member, you can increase the number of bookmarks you can save and organize them with labels.

Free membership registration

Specialized graph creation software for environmental science 'SigmaPlot'

A data analysis and graph creation tool that elevates the research results of environmental science to unparalleled expression.

In the field of environmental science, particularly in pollution monitoring, the accurate visualization and analysis of observational data are crucial for understanding situations and formulating countermeasures. Clearly demonstrating changes in pollution levels over time and the correlations between multiple pollutants is essential for communicating research findings and building consensus among stakeholders. Inadequate graphical representations can fail to convey the true meaning of the data and may lead to misunderstandings. SigmaPlot is a specialized tool that supports the creation of graphs and data analysis to accurately represent research outcomes in environmental science. 【Usage Scenarios】 - Graphing the temporal changes of pollutants - Creating graphs to compare data from multiple observation points - Correlation analysis graphs between environmental data and meteorological data - Producing high-quality graphs for paper presentations and report writing 【Benefits of Implementation】 - Makes it easier to visually grasp trends in pollution monitoring data - Allows for clear expression of complex data relationships - Increases the reliability and persuasiveness of research findings Basic Operations of SigmaPlot (link to Hulinks page) https://www.hulinks.co.jp/software/sigmaplot/sigmaplot_bso_guide/

  • SigmaPlot_butterflyplot.png
  • SigmaPlot_confidencebands1.png
  • SigmaPlot_violinplot.png
  • Software (middle, driver, security, etc.)
  • Graph Analysis
  • Statistical analysis
  • soft

Added to bookmarks

Bookmarks list

Bookmark has been removed

Bookmarks list

You can't add any more bookmarks

By registering as a member, you can increase the number of bookmarks you can save and organize them with labels.

Free membership registration

Specialized graph creation software 'SigmaPlot' for agriculture and livestock.

Visualize reproductive data with high precision and accurately represent research results.

The analysis and visualization of growth data in the fields of agriculture and livestock are crucial elements for managing crop growth and understanding the health status of livestock. In particular, accurately capturing daily changes in growth conditions and understanding trends are essential for predicting yields and improving production efficiency. Inadequate data analysis or representation can lead to misunderstandings of the situation and may result in missed opportunities to implement appropriate measures. SigmaPlot, as a specialized graphing software focused on science and technology, addresses these challenges. 【Use Cases】 - Comparison of growth conditions by field - Monitoring growth curves and health indicators of livestock - Correlation analysis between weather data and growth data - Graphing experimental results and presenting papers 【Benefits of Implementation】 - Makes it easier to visually grasp trends in growth data - Supports accurate decision-making based on data - Enables clear presentation of research results SigmaPlot Basic Operations (Link to Hulinks page) https://www.hulinks.co.jp/software/sigmaplot/sigmaplot_bso_guide/

  • SigmaPlot_butterflyplot.png
  • SigmaPlot_confidencebands1.png
  • SigmaPlot_violinplot.png
  • Software (middle, driver, security, etc.)
  • Graph Analysis
  • Statistical analysis
  • soft

Added to bookmarks

Bookmarks list

Bookmark has been removed

Bookmarks list

You can't add any more bookmarks

By registering as a member, you can increase the number of bookmarks you can save and organize them with labels.

Free membership registration

Specialized graph creation software 'SigmaPlot' for materials science

A data analysis and graph creation tool to express the research results of materials science more clearly.

In the field of materials science, it is essential to accurately grasp the properties and changes of substances and to visualize the results in an easily understandable manner. Particularly in the development of new materials and the performance evaluation of existing materials, precise analysis of experimental data and the creation of graphs that accurately represent this data significantly impact the progress of research and the quality of results presentations. Inadequate graph representation can fail to convey the meaning of the data sufficiently and may lead to misunderstandings. SigmaPlot provides researchers in materials science with the tools necessary for creating publication-quality clear graphs, detailed data analysis, and a wealth of resources for presentations, thereby supporting the accurate expression of research results. 【Usage Scenarios】 - Graphing physical property data of materials (e.g., strength, hardness, thermal conductivity, electrical conductivity, etc.) - Trend analysis and visualization of experimental results - Creation of high-quality graphs for papers and conference presentations - Efficient management and analysis of complex datasets 【Benefits of Implementation】 - Objective and accurate communication of research data - Enhanced understanding of research results and increased persuasiveness - Improved evaluation in paper presentations and conferences - Streamlined workflow from data analysis to graph creation

  • SigmaPlot_butterflyplot.png
  • SigmaPlot_confidencebands1.png
  • SigmaPlot_violinplot.png
  • Software (middle, driver, security, etc.)
  • Graph Analysis
  • Statistical analysis
  • soft

Added to bookmarks

Bookmarks list

Bookmark has been removed

Bookmarks list

You can't add any more bookmarks

By registering as a member, you can increase the number of bookmarks you can save and organize them with labels.

Free membership registration

Specialized graphing software 'SigmaPlot' for food and beverage applications.

Data analysis and graph creation tools to support quality control in food and beverages.

In the food and beverage industry, quality control requires accurate recording and analysis of data throughout the manufacturing process to maintain product safety and quality. It is particularly important to visualize a wide range of data, from the acceptance of raw materials to the manufacturing process and final product inspection, in order to understand trends. Inadequate data management and analysis can lead to variations in quality and potential complaints. SigmaPlot addresses these challenges by providing specialized graphing and data analysis functions tailored to scientific technology, supporting the efficiency and accuracy of quality management operations. 【Use Cases】 - Graphing time-series changes in temperature, humidity, pH, etc., on the production line - Comparing and evaluating the results of raw material component analyses - Graphical display of product stability test data - Early detection of deviations from quality standards 【Benefits of Implementation】 - Objective evaluation and sharing of quality data - Data-driven decision-making for quality improvement - Stabilization of manufacturing processes and improvement of yield Basic Operations of SigmaPlot (Link to Hulinks page) https://www.hulinks.co.jp/software/sigmaplot/sigmaplot_bso_guide/

  • SigmaPlot_butterflyplot.png
  • SigmaPlot_confidencebands1.png
  • SigmaPlot_violinplot.png
  • Software (middle, driver, security, etc.)
  • Graph Analysis
  • Statistical analysis
  • soft

Added to bookmarks

Bookmarks list

Bookmark has been removed

Bookmarks list

You can't add any more bookmarks

By registering as a member, you can increase the number of bookmarks you can save and organize them with labels.

Free membership registration

Professional Graph Creation for the Energy Industry: SigmaPlot

A data analysis tool that visualizes energy efficiency analysis and enhances research outcomes.

In the energy industry, accurate visualization and detailed analysis of data are required for analyzing plant operational efficiency and energy consumption. Particularly, specialized graphing and data analysis capabilities are essential for understanding complex energy flows and variations in efficiency. Inadequate analysis can lead to missed improvement opportunities and inefficient operations. SigmaPlot provides the specialized graphing and data analysis functions necessary for energy efficiency analysis, supporting the accurate representation of research results. 【Usage Scenarios】 - Correlation analysis of plant energy consumption and production - Visualization of fluctuations in renewable energy generation - Measurement of the effectiveness of energy efficiency improvement measures - Data presentation in research papers and reports 【Benefits of Implementation】 - Clarification of energy efficiency challenges - Objective evaluation of the effectiveness of improvement measures - Enhanced persuasiveness of research results - Rapid data analysis and report creation SigmaPlot Basic Operations (Link to Hulinks page) https://www.hulinks.co.jp/software/sigmaplot/sigmaplot_bso_guide/

  • SigmaPlot_butterflyplot.png
  • SigmaPlot_confidencebands1.png
  • SigmaPlot_violinplot.png
  • Software (middle, driver, security, etc.)
  • Graph Analysis
  • Statistical analysis
  • soft

Added to bookmarks

Bookmarks list

Bookmark has been removed

Bookmarks list

You can't add any more bookmarks

By registering as a member, you can increase the number of bookmarks you can save and organize them with labels.

Free membership registration

Specialized graph creation software for physics: 'SigmaPlot'

A data analysis and graph creation tool that more accurately represents the results of physics experiments.

In the field of physics, accurately visualizing data obtained from experiments and clearly communicating the results is crucial for the advancement of research and the presentation of papers. In particular, experimental data capturing complex phenomena only reveals its significance through appropriate graphical representation. Inadequate graphical representation can lead to misunderstandings of research findings. SigmaPlot supports the precise expression of research results by providing publication-quality graphing capabilities and advanced data analysis functions to address the challenges faced by researchers in physics. 【Usage Scenarios】 - Visualization of experimental data - Creation of graphs for paper presentations - Preparation of conference presentation materials - Sharing of research results 【Benefits of Implementation】 - Accurate communication of experimental results - Enhanced persuasiveness of research - Efficient data analysis and graph creation - Improved quality of papers Basic Operations of SigmaPlot (Link to Hulinks page) https://www.hulinks.co.jp/software/sigmaplot/sigmaplot_bso_guide/

  • SigmaPlot_butterflyplot.png
  • SigmaPlot_confidencebands1.png
  • SigmaPlot_violinplot.png
  • Software (middle, driver, security, etc.)
  • Graph Analysis
  • Statistical analysis
  • soft

Added to bookmarks

Bookmarks list

Bookmark has been removed

Bookmarks list

You can't add any more bookmarks

By registering as a member, you can increase the number of bookmarks you can save and organize them with labels.

Free membership registration

Software Design and Development Case Studies: [Machine Tool Equipment (Sheet Metal Processing, etc.)]

Introduction to software design and development examples for machine tools (such as sheet metal processing)!

We provide systems using touch panels and PLCs for work machinery devices (such as sheet metal processing)! (Including hardware design such as electrical circuits, control panels, and wiring work) Please leave software design and development, as well as electrical circuit design (sequence circuits), to us! ========================== You can view our business achievements (videos and still images) at the following URL: http://9323.teacup.com/mka/bbs/ ==========================

  • Embedded system design service
  • soft

Added to bookmarks

Bookmarks list

Bookmark has been removed

Bookmarks list

You can't add any more bookmarks

By registering as a member, you can increase the number of bookmarks you can save and organize them with labels.

Free membership registration

OrCAD Capture R10 Viewer Data Conversion Software

OrCAD Capture R10 Viewer Data Conversion Software

The viewer is free to use, so anyone can access it. It allows for online tracking and symbol searching, among other features. These functions improve the efficiency of checking drawings.

  • Other CAD
  • Process Control System
  • Data conversion software
  • soft

Added to bookmarks

Bookmarks list

Bookmark has been removed

Bookmarks list

You can't add any more bookmarks

By registering as a member, you can increase the number of bookmarks you can save and organize them with labels.

Free membership registration

CR5000/BD Viewer Data Conversion Software

CR5000/BD Viewer Data Conversion Software

The viewer is free to use, so anyone can utilize it. It allows for online tracking, gap investigations through layer overlays, and more. The search for individual parts and the coordinate jump function improve the efficiency of inspection.

  • Other CAD
  • Process Control System
  • others
  • soft

Added to bookmarks

Bookmarks list

Bookmark has been removed

Bookmarks list

You can't add any more bookmarks

By registering as a member, you can increase the number of bookmarks you can save and organize them with labels.

Free membership registration

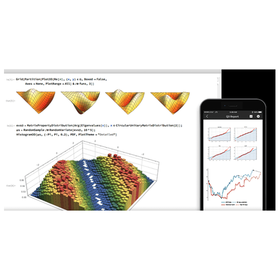
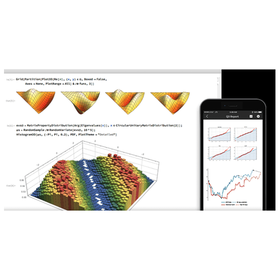
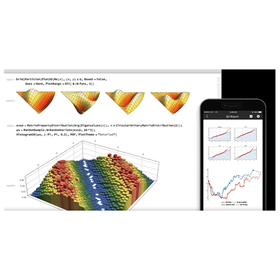
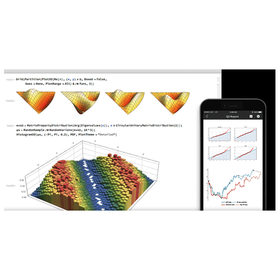
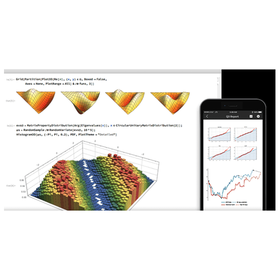
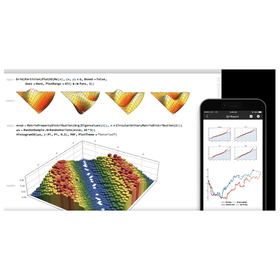
Visualization of complex formulas and phenomena for education: 'Mathematica'

Bringing ideas from the educational field to life. Equipped with countless functions.

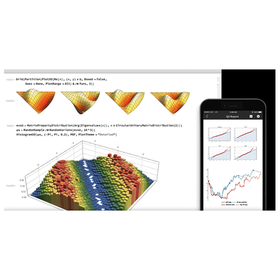
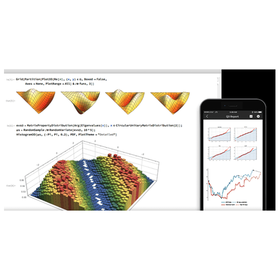
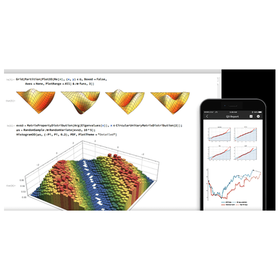
In the educational field, it is required to present complex concepts in an easy-to-understand manner and provide practical exercises in the creation of teaching materials to deepen students' understanding. Particularly in fields such as science, mathematics, and engineering, simulations based on concrete data and visual representations are crucial for enhancing learning effectiveness. Inadequate teaching materials can lead to decreased student motivation and delays in understanding. 'Mathematica' serves as a processing system equipped with countless functions, supporting educators in material creation that embodies ideas and provides students with surprise and discovery in response to these challenges. 【Usage Scenarios】 - Visualization of complex formulas and phenomena - Creation of interactive exercise problems - Development of teaching materials based on data analysis - Introduction to programming learning 【Effects of Implementation】 - Increased student motivation - Promotion of understanding of abstract concepts - Development of practical problem-solving skills - Reduction of the burden on educators in material creation

  • 1_WSM_window.jpg
  • case_mathematica_k_03.png
  • v103_10.png
  • IPROS15020293275197320398.png
  • Mathematical processing
  • Visualization
  • Other research software
  • soft

Added to bookmarks

Bookmarks list

Bookmark has been removed

Bookmarks list

You can't add any more bookmarks

By registering as a member, you can increase the number of bookmarks you can save and organize them with labels.

Free membership registration

Data analysis of manufacturing lines using 'Mathematica' for the manufacturing industry.

Supporting quality control in manufacturing. Seamlessly from ideas to results.

In quality control within the manufacturing industry, maintaining stable product quality and early detection and investigation of defects are essential. In particular, complex data analysis and understanding subtle variations in the manufacturing process are directly linked to product reliability. Inappropriate analysis or decisions not based on data can lead to quality deterioration and production losses. 'Mathematica' serves as a processing system equipped with countless functions, becoming a partner in the realization of ideas and research and development, providing surprises and discoveries. 【Usage Scenarios】 - Anomaly detection through data analysis of manufacturing lines - Performance prediction and quality improvement of products - Statistical analysis and visualization of experimental data - Automation of appearance inspection using image processing 【Benefits of Implementation】 - Increased efficiency in quality control operations - Improvement and stabilization of product quality - Reduction in defect occurrence rates - Rapid decision-making based on data

  • 1_WSM_window.jpg
  • case_mathematica_k_03.png
  • v103_10.png
  • IPROS15020293275197320398.png
  • Mathematical processing
  • Visualization
  • Other research software
  • soft

Added to bookmarks

Bookmarks list

Bookmark has been removed

Bookmarks list

You can't add any more bookmarks

By registering as a member, you can increase the number of bookmarks you can save and organize them with labels.

Free membership registration

CR5000/PWS Viewer Data Conversion Software

Anytime, anywhere, anyone can perform CAD-like inspections! Free viewer software.

The viewer is free to use, so anyone can utilize it. It allows for online tracking and gap analysis through layer overlays. It improves drawing inspection efficiency with features such as searching for component placement positions and jumping to coordinates.

  • Other CAD
  • Process Control System
  • others
  • soft

Added to bookmarks

Bookmarks list

Bookmark has been removed

Bookmarks list

You can't add any more bookmarks

By registering as a member, you can increase the number of bookmarks you can save and organize them with labels.

Free membership registration

Market Risk Modeling for Finance with 'Mathematica'

Accelerating financial risk analysis with countless built-in functions.

In the financial industry, it is essential to accurately analyze complex market fluctuations and diverse risk factors to predict future trends. In particular, advanced computational capabilities and flexible modeling functions are indispensable for evaluating market risk, credit risk, and operational risk. Inadequate analysis can lead to unexpected losses or opportunity costs. 'Mathematica' is a processing system equipped with numerous functions specialized for the financial sector, seamlessly guiding users from ideas to results. 【Use Cases】 - Market risk modeling - Credit risk assessment - Portfolio optimization - Derivative pricing - Algorithmic trading strategy development 【Benefits of Implementation】 - Accelerated advanced risk analysis - Construction of sophisticated predictive models - Support for data-driven decision-making - Promotion of the development of new financial products - Streamlining of the analysis process

  • 1_WSM_window.jpg
  • case_mathematica_k_03.png
  • v103_10.png
  • IPROS15020293275197320398.png
  • Mathematical processing
  • Visualization
  • Other research software
  • soft

Added to bookmarks

Bookmarks list

Bookmark has been removed

Bookmarks list

You can't add any more bookmarks

By registering as a member, you can increase the number of bookmarks you can save and organize them with labels.

Free membership registration

Economic Data Statistical Modeling 'Mathematica' for Economics

Seamlessly from idea to result in economic statistical modeling.

In the field of economics, intricate data analysis and statistical modeling require precise calculations and flexible responses. Particularly in forecasting economic phenomena and formulating policies, building accurate models and deriving rapid results are crucial. Inappropriate analytical tools can lead to incorrect conclusions and inefficient decision-making. Mathematica is a processing system equipped with countless functions to meet the needs of statistical modeling in economics. 【Use Cases】 - Statistical modeling of economic data - Construction of econometric models - Simulation analysis - Development of forecasting models 【Benefits of Implementation】 - Increased efficiency in advanced statistical analysis - Realization of highly accurate economic forecasts - Acceleration of research and development - Promotion of new discoveries and insights

  • 1_WSM_window.jpg
  • case_mathematica_k_03.png
  • v103_10.png
  • IPROS15020293275197320398.png
  • Mathematical processing
  • Visualization
  • Other research software
  • soft

Added to bookmarks

Bookmarks list

Bookmark has been removed

Bookmarks list

You can't add any more bookmarks

By registering as a member, you can increase the number of bookmarks you can save and organize them with labels.

Free membership registration

Advanced Simulation 'Mathematica' for Scientific Research

Seamlessly simulating scientific research from idea to result.

In the field of scientific research, advanced simulations are required to elucidate and predict complex phenomena. In particular, precise calculations and flexible data processing capabilities are crucial elements that influence the quality of research. Insufficient computational power and cumbersome interfaces can lead to delays in research and missed opportunities for new discoveries. 'Mathematica' is a powerful tool that embodies the ideas of simulation in scientific research, serving as a partner in research and development, providing surprises and discoveries. 【Usage Scenarios】 - Simulation of complex physical phenomena - Construction of data-driven predictive models - Algorithm development and validation - Design and analysis of mathematical models 【Effects of Implementation】 - Increased efficiency and acceleration of research and development - Promotion of new insights and discoveries - Improved accuracy through advanced computational processing - Easier visualization and sharing of research results

  • 1_WSM_window.jpg
  • case_mathematica_k_03.png
  • v103_10.png
  • IPROS15020293275197320398.png
  • Mathematical processing
  • Visualization
  • Other research software
  • soft

Added to bookmarks

Bookmarks list

Bookmark has been removed

Bookmarks list

You can't add any more bookmarks

By registering as a member, you can increase the number of bookmarks you can save and organize them with labels.

Free membership registration

Mathematical Model Construction for Engineering 'Mathematica'

Built-in countless functions to assist in design optimization.

In the field of engineering, particularly in design optimization, there is a demand for performing complex calculations and simulations accurately and efficiently. Considering various conditions and parameters from the initial to the final stages of design to derive optimal solutions leads to improvements in product performance and reductions in development time. Insufficient analysis or calculation errors can result in redesigns or decreased product performance. 'Mathematica' serves as an essential tool for design optimization, providing seamless support from the realization of ideas to the derivation of results in response to these challenges. 【Usage Scenarios】 - Construction and analysis of complex mathematical models - Exploration of design space through parameter studies - Application of optimization algorithms - Visualization and evaluation of simulation results 【Benefits of Implementation】 - Streamlining and accelerating the design process - Discovery of more accurate design solutions - Reduction of development costs - Improvement of product performance

  • 1_WSM_window.jpg
  • case_mathematica_k_03.png
  • v103_10.png
  • IPROS15020293275197320398.png
  • Mathematical processing
  • Visualization
  • Other research software
  • soft

Added to bookmarks

Bookmarks list

Bookmark has been removed

Bookmarks list

You can't add any more bookmarks

By registering as a member, you can increase the number of bookmarks you can save and organize them with labels.

Free membership registration

Building Demand Forecasting Models for the Energy Industry 'Mathematica'

Advanced energy demand forecasting. Equipped with countless functions.

In the energy industry, accurate demand forecasting is essential for stable supply and efficient operations. In particular, responding to demand fluctuations caused by climate change and social conditions requires advanced analytical capabilities and rapid data processing. Uncertain forecasts can lead to opportunity losses and increased costs due to oversupply or shortages. 'Mathematica' serves as a processing system equipped with countless functions, becoming a partner in the realization of ideas and research and development, providing surprises and discoveries. 【Usage Scenarios】 - Building demand forecasting models based on past weather data, economic indicators, and event information - Improving forecasting accuracy through real-time data acquisition and analysis - Identifying future demand patterns using machine learning 【Benefits of Implementation】 - Optimization of inventory management and power generation planning through improved demand forecasting accuracy - Contribution to the stabilization of energy supply and cost reduction - Discovery of new business opportunities

  • 1_WSM_window.jpg
  • case_mathematica_k_03.png
  • v103_10.png
  • IPROS15020293275197320398.png
  • Mathematical processing
  • Visualization
  • Other research software
  • soft

Added to bookmarks

Bookmarks list

Bookmark has been removed

Bookmarks list

You can't add any more bookmarks

By registering as a member, you can increase the number of bookmarks you can save and organize them with labels.

Free membership registration

Using 'Mathematica' for noise reduction in medical imaging

Transforming ideas in medical image analysis into rapid results. Equipped with countless functions.

In the field of medical imaging analysis, advanced data processing capabilities are required to improve diagnostic accuracy and discover new insights. In particular, capturing subtle changes from complex image data and conducting quantitative evaluations are crucial for diagnostic support and research and development. Inadequate analysis tools can lead to oversights and incorrect judgments. 'Mathematica' incorporates numerous essential functions for medical image analysis, such as image processing, neural networks, and machine learning, supporting everything from the realization of ideas to the derivation of results. 【Use Cases】 - Noise reduction and enhancement of medical images - Automation of lesion detection and segmentation - Quantitative analysis based on image data - Development of diagnostic support models using machine learning 【Benefits of Implementation】 - Contributes to improved diagnostic accuracy - Reduces analysis time and enhances efficiency - Promotes new research and development

  • 1_WSM_window.jpg
  • case_mathematica_k_03.png
  • v103_10.png
  • IPROS15020293275197320398.png
  • Mathematical processing
  • Visualization
  • Other research software
  • soft

Added to bookmarks

Bookmarks list

Bookmark has been removed

Bookmarks list

You can't add any more bookmarks

By registering as a member, you can increase the number of bookmarks you can save and organize them with labels.

Free membership registration

Aspen SeisEarth (seismic exploration data interpretation software)

A one-stop solution that supports all seismic exploration interpretations.

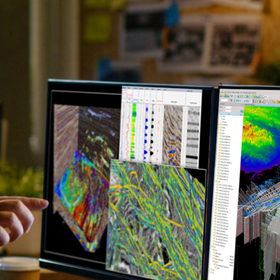
Aspen SeisEarth (seismic exploration data interpretation software) is a powerful analysis and visualization suite that can flexibly respond to everything from wide-area surveys to the evaluation of individual prospects (promising structures). It demonstrates its true value not only in traditional oil and gas development but also in underground investigations in sustainable energy fields such as geothermal energy and CCS (carbon capture and storage). Strengths of Aspen SeisEarth: ▪ Wide-scale interpretation: Enables insights that cannot be obtained by viewing individual survey data in isolation. ▪ Complete visual integration: Supports rapid decision-making based on sufficient evidence by sharing information. ▪ Agile data management: Operates on an extremely agile data management system designed specifically for the data characteristics of the oil and gas industry. ▪ Optimization for modern hardware: Designed to maximize the capabilities of modern computers' high-speed graphics, large memory, and fast connections. ▪ Access to advanced features: Allows easy access to prestack data, geological correlations, and advanced modeling tools with just a mouse click.

  • Structural Analysis
  • Other analyses
  • soft

Added to bookmarks

Bookmarks list

Bookmark has been removed

Bookmarks list

You can't add any more bookmarks

By registering as a member, you can increase the number of bookmarks you can save and organize them with labels.

Free membership registration

Molecular Structure Visualization and Analysis for Pharmaceuticals 'Mathematica'

Molecular modeling ideas, leading to rapid results. Equipped with countless functions.

In the pharmaceutical industry, molecular modeling requires advanced computational power and flexible data processing for the analysis and simulation of complex molecular structures. Particularly in the early stages of new drug development, accurately predicting the properties of candidate compounds and efficiently screening them significantly impacts the speed and success rate of research and development. Inadequate analysis tools can lead to increased time and costs, as well as potential delays in development. 'Mathematica' serves as an integrated system with countless built-in functions, providing a partner for the realization of ideas and research and development. 【Usage Scenarios】 - Visualization and analysis of molecular structures - Simulation of compound property predictions - Exploration of candidate compounds in drug design - Protein structure analysis - Applications in chemoinformatics 【Effects of Implementation】 - Improved computational efficiency in molecular modeling - Shortened research and development cycles - Promotion of new discoveries and insights - Extraction of insights from complex data

  • 1_WSM_window.jpg
  • case_mathematica_k_03.png
  • v103_10.png
  • IPROS15020293275197320398.png
  • Mathematical processing
  • Visualization
  • Other research software
  • soft

Added to bookmarks

Bookmarks list

Bookmark has been removed

Bookmarks list

You can't add any more bookmarks

By registering as a member, you can increase the number of bookmarks you can save and organize them with labels.

Free membership registration

Data Feature Extraction for Data Science: 'Mathematica'

Seamlessly from idea to result in data science pattern recognition.

In the field of data science, it is essential to extract meaningful patterns from complex data and utilize them for predictions and decision-making. Particularly in pattern recognition, high-precision analysis and rapid presentation of results significantly influence the speed of research and development. Inadequate analysis tools can lead to oversights and incorrect conclusions. 'Mathematica' is equipped with outstanding capabilities in all areas of technical computation in data science, including neural networks and machine learning, and strongly supports advanced analysis in pattern recognition. 【Usage Scenarios】 - Feature extraction from large datasets - Development of anomaly detection algorithms - Pattern identification in image recognition - Trend analysis of time series data 【Benefits of Implementation】 - Improved pattern recognition accuracy - Reduced analysis time - Promotion of new insights discovery - Enhanced efficiency in research and development

  • 1_WSM_window.jpg
  • case_mathematica_k_03.png
  • v103_10.png
  • IPROS15020293275197320398.png
  • Mathematical processing
  • Visualization
  • Other research software
  • soft

Added to bookmarks

Bookmarks list

Bookmark has been removed

Bookmarks list

You can't add any more bookmarks

By registering as a member, you can increase the number of bookmarks you can save and organize them with labels.

Free membership registration

Orbital Design and Analysis of Satellites for Space Development 'Mathematica'

Seamless orbital calculations. Equipped with countless functions.

In the field of space development, accurate orbital calculations for satellites and spacecraft are essential for mission success. In particular, precise orbital predictions that take into account complex gravitational fields and perturbations lead to safe and efficient operations. Inaccurate calculations can pose risks such as orbital deviations and fuel wastage. 'Mathematica' has countless built-in functions available in the fields of science and engineering, supporting advanced orbital calculations. [Usage Scenarios] - Orbital design and analysis for satellites - Orbital planning for interplanetary missions - Perturbation calculations in orbit - Planning for orbital maneuvers [Effects of Implementation] - Increased mission success rates through high-precision orbital calculations - Accelerated development cycles due to reduced computation time - Modeling and simulation of complex physical phenomena - Utilization as a research and development partner

  • 1_WSM_window.jpg
  • case_mathematica_k_03.png
  • v103_10.png
  • IPROS15020293275197320398.png
  • Mathematical processing
  • Visualization
  • Other research software
  • soft

Added to bookmarks

Bookmarks list

Bookmark has been removed

Bookmarks list

You can't add any more bookmarks

By registering as a member, you can increase the number of bookmarks you can save and organize them with labels.

Free membership registration