We have compiled a list of manufacturers, distributors, product information, reference prices, and rankings for soft.
ipros is IPROS GMS IPROS One of the largest technical database sites in Japan that collects information on.

soft Product List and Ranking from 369 Manufacturers, Suppliers and Companies | IPROS GMS

Last Updated: Aggregation Period:Jun 10, 2026~Jul 07, 2026
This ranking is based on the number of page views on our site.

soft Manufacturer, Suppliers and Company Rankings

Last Updated: Aggregation Period:Jun 10, 2026~Jul 07, 2026
This ranking is based on the number of page views on our site.

  1. フォトン Kyoto//software
  2. ウェーブフロント 本社 Kanagawa//software
  3. B7 Tokyo//software
  4. 日本イーエスアイ Tokyo//software
  5. 5 イー・アイ・ソル Tokyo//Testing, Analysis and Measurement

soft Product ranking

Last Updated: Aggregation Period:Jun 10, 2026~Jul 07, 2026
This ranking is based on the number of page views on our site.

  1. Thermal image analysis software "EI-STUDIO" for FLIR thermal cameras. イー・アイ・ソル
  2. VillageVIEW TS Protocol Analysis Software ヴィレッジアイランド
  3. 3D Electromagnetic Wave Analysis Software (Frequency Response) WAVEjω フォトン
  4. 4 Analysis software "BELMaster"
  5. 5 Impact and Collision Analysis Software PAM-CRASH 日本イーエスアイ

soft Product List

841~870 item / All 1468 items

Displayed results

■Electric Field Analysis Software (Boundary Element Method) VOLTBM

3D electric field analysis software (electric field simulator) using the boundary element method *No air mesh required.

Three-dimensional electric field (electric field) analysis software using boundary element method for static analysis (electric field simulator) ■□■Features■□■ ■You can create an analysis model without creating an air region. ■Since it is integrated with the PHOTO series dedicated pre/post, data creation, analysis, and result processing can be performed as a series of operations. ■You can create display elements to evaluate the analysis values in the space.

  • Magnetic field analysis/electromagnetic wave analysis
  • Analysis Services
  • Contract Analysis
  • soft

Added to bookmarks

Bookmarks list

Bookmark has been removed

Bookmarks list

You can't add any more bookmarks

By registering as a member, you can increase the number of bookmarks you can save and organize them with labels.

Free membership registration

■ Magnetic field analysis software (combined method, frequency response) EDDYTMjω

3D magnetic field analysis software (magnetic field simulator) using a combination of finite element method and H-method *No air mesh required.

■ Magnetic field/magnetic field analysis software (magnetic field simulator) using a combination of the finite element method and H-method, capable of performing static analysis and frequency response analysis. ■ Can handle three-dimensional problems. ■□■ Features ■□■ ■ Can create analysis models without creating air regions. ■ Integrated with the PHOTO series dedicated pre- and post-processing, allowing data creation, analysis, and result processing to be performed as a single operation. ■ Achieves revolutionary speedup through the combination of edge element method and ICCG method (dozens of times faster than conventional finite element methods). ■ Provides stable solutions using the finite element method, making it safe for beginners to use.

  • Magnetic field analysis/electromagnetic wave analysis
  • Analysis Services
  • Contract Analysis
  • soft

Added to bookmarks

Bookmarks list

Bookmark has been removed

Bookmarks list

You can't add any more bookmarks

By registering as a member, you can increase the number of bookmarks you can save and organize them with labels.

Free membership registration

■Electric field analysis software (frequency response) VOLTjω

Frequency response electric field analysis software using the finite element method.

Perform static analysis and frequency response analysis Electric field analysis software using the finite element method (Electric field simulator) ■□■Features■□■ ■Since it is integrated with the PHOTO series dedicated pre- and post-processing, data creation, analysis, and result processing can be performed as a continuous operation. ■It is integrated with other PHOTO series modules, allowing for easy coupled analysis, such as obtaining temperature distribution from heat generation determined by electromagnetic field analysis. ■Using the ICCG method, calculations are fast, enabling analysis on a personal computer. ■Since it uses the finite element method, the solutions are stable, making it safe for beginners to use.

  • Magnetic field analysis/electromagnetic wave analysis
  • Analysis Services
  • Contract Analysis
  • soft

Added to bookmarks

Bookmarks list

Bookmark has been removed

Bookmarks list

You can't add any more bookmarks

By registering as a member, you can increase the number of bookmarks you can save and organize them with labels.

Free membership registration

[Analysis Case] Electromagnetic Field Analysis of Polyethylene-Filled Waveguides

Here is an example of a comparison between the obtained reflection coefficient from the analysis results and the theoretical values!

When a dielectric such as polyethylene is filled in a rectangular waveguide, reflections of electromagnetic waves occur at the air interface. Considering a system where polyethylene is filled in part of a rectangular waveguide of standard WRJ-5, the distribution of electromagnetic waves was analyzed using the finite element method. As a result, it was found that the absolute value of the electric field on the polyethylene side is constant, indicating that no reflection occurs at the output surface (the impedance boundary is correctly set). [Case Summary] ■ Analysis Module: PHOTO-WAVEjω ■ Analysis Results - It is evident that no reflection occurs at the output surface since the absolute value of the electric field on the polyethylene side is constant (the impedance boundary is correctly set). - In the calculation of the scattering matrix, the characteristic impedances of air and polyethylene were set as ZAir = 279.052Ω and ZPE = 156.987Ω. *For more details, please refer to the related links or feel free to contact us.

  • image_07.png
  • image_08.png
  • image_09.png
  • image_10.png
  • image_11.png
  • image_12.png
  • Magnetic field analysis/electromagnetic wave analysis
  • Analysis Services
  • Contract Analysis
  • soft

Added to bookmarks

Bookmarks list

Bookmark has been removed

Bookmarks list

You can't add any more bookmarks

By registering as a member, you can increase the number of bookmarks you can save and organize them with labels.

Free membership registration

[Analysis Case] Input Impedance Analysis of a Dipole Antenna

Set impedance boundaries at the model boundary! Here are examples compared with the results of the moment method.

We will introduce a case study analyzing the input impedance of a dipole antenna using the electromagnetic wave analysis software "PHOTO-WAVEjω." The antenna has a diameter of 1mm, a length of 60.5mm, and a gap of 0.5mm. An impedance boundary was set at the model boundary. The antenna was treated as a perfect conductor. 【Case Overview】 ■ Software Used: PHOTO-WAVEjω ■ Analysis Conditions - An impedance boundary was set at the model boundary - The antenna was treated as a perfect conductor *For more details, please refer to the related links or feel free to contact us.

  • image_20.png
  • image_21.png
  • Magnetic field analysis/electromagnetic wave analysis
  • Analysis Services
  • Contract Analysis
  • soft

Added to bookmarks

Bookmarks list

Bookmark has been removed

Bookmarks list

You can't add any more bookmarks

By registering as a member, you can increase the number of bookmarks you can save and organize them with labels.

Free membership registration

[Case Study] Photonic Crystal Optical Waveguide (Electromagnetic Field Analysis)

Conducting electromagnetic wave analysis using the finite element method! Introducing a case study of an L-shaped optical waveguide.

Photonic crystals are structures that can control light by periodically arranging multiple dielectrics and other materials. Electromagnetic wave analysis was conducted using the finite element method. The optical waveguide consists of periodically arranged dielectric rods, and light passes through areas where there are no dielectric rods. The radius of the rods, r, and the period of the rods, a, are set as r = 0.18a, and the electric field component parallel to the dielectric rods was input. 【Case Overview】 ■ Software Used: PHOTO-WAVEjω ■ Analysis Conditions - The radius of the rods, r, and the period of the rods, a, are set as r = 0.18a (Wavelength λ: 1.55μm, Refractive index n: 3.4) - Impedance boundary conditions are set on the sides - The electric field component parallel to the dielectric rods was input *For more details, please refer to the related links or feel free to contact us.

  • image_29.png
  • image_19.png
  • image_24.png
  • image_25.png
  • Magnetic field analysis/electromagnetic wave analysis
  • Analysis Services
  • Contract Analysis
  • soft

Added to bookmarks

Bookmarks list

Bookmark has been removed

Bookmarks list

You can't add any more bookmarks

By registering as a member, you can increase the number of bookmarks you can save and organize them with labels.

Free membership registration

[Analysis Case] Analysis using automatic load condition setting function (TE wave, TM wave)

Specify a set of nodes that are on the same plane! Calculate the electric field at each node and set it as the loading condition.

In versions prior to Ver8.0 of "PHOTO-WAVEjω," it was necessary to set the electric field (3 components) at nodes or the current density (3 components) at elements as load conditions. Since Ver8.2, a feature has been added to automatically set these load conditions. Users can specify a set of nodes that are on the same plane, and by simply inputting a few parameters, the program calculates the electric field at each node and sets it as the load condition. [Issues] ■ In versions prior to Ver8.0 of "PHOTO-WAVEjω," it was necessary to set the electric field at nodes or the current density at elements as load conditions. ■ When setting the electric field in a rectangular waveguide, it was necessary to set each electric field component from the coordinates of each node, which was a cumbersome task for users. *For more details, please refer to the related links or feel free to contact us.

  • image_31.png
  • image_17.png
  • image_01.png
  • image_02.png
  • image_03.png
  • image_04.png
  • image_05.png
  • image_06.png
  • image_07.png
  • Magnetic field analysis/electromagnetic wave analysis
  • Analysis Services
  • Contract Analysis
  • soft

Added to bookmarks

Bookmarks list

Bookmark has been removed

Bookmarks list

You can't add any more bookmarks

By registering as a member, you can increase the number of bookmarks you can save and organize them with labels.

Free membership registration

[Analysis Case] Magnetic Field Analysis of Gear Sensors

Check how the magnetic field distribution changes when the electrical conductivity, rotation speed, and position of the gears are altered!

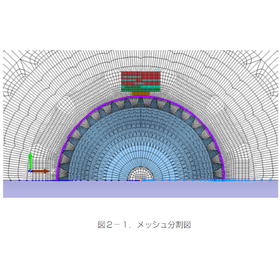
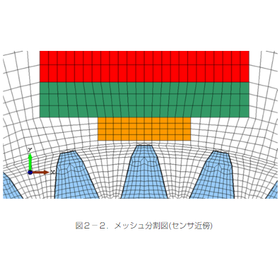
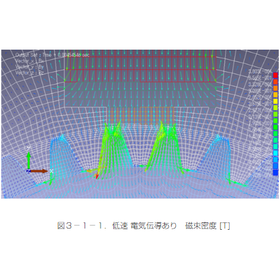
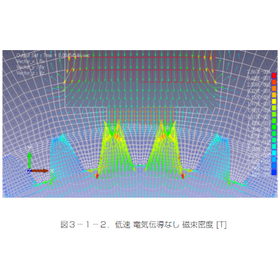
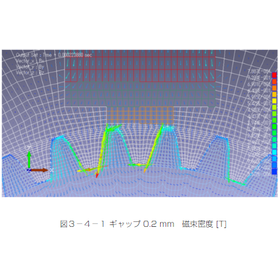
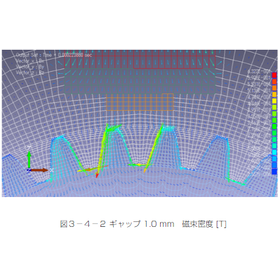
When a magnet is brought close to a gear made of a magnetic material, the distribution of the surrounding magnetic field changes depending on the position and rotation speed of the gear. A permanent magnet was placed near the rotating gear, and the changes in the surrounding magnetic field were analyzed. As a result, in the comparison of magnetic flux density due to rotation speed, the gear rotating at high speed exhibited a larger magnetic field along the edge of the gear, and a magnetic field due to eddy currents remained even when it was away from the magnet. 【Case Summary】 ■ Analysis Type: 3D Nonlinear Transient Magnetic Field Analysis ■ Analysis Module: PHOTO-EDDY *For more details, please refer to the related links or feel free to contact us.

  • image_14.png
  • image_15.png
  • image_16.png
  • image_18.png
  • image_20.png
  • image_21.png
  • Magnetic field analysis/electromagnetic wave analysis
  • Analysis Services
  • Contract Analysis
  • soft

Added to bookmarks

Bookmarks list

Bookmark has been removed

Bookmarks list

You can't add any more bookmarks

By registering as a member, you can increase the number of bookmarks you can save and organize them with labels.

Free membership registration

[Analysis Case] Magnetic Field Analysis of a Transformer

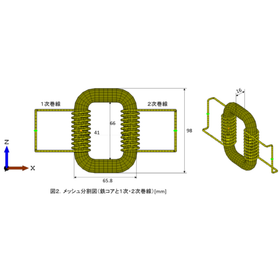
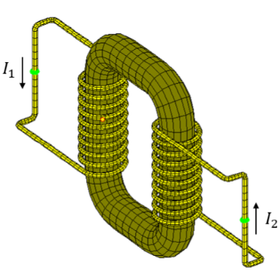
Finite element division of the iron core and primary/secondary windings! A node current of 1A at 1000Hz was applied.

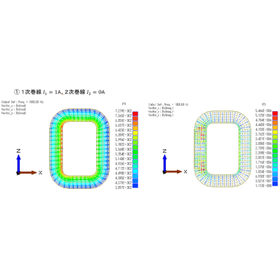
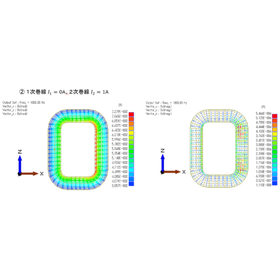
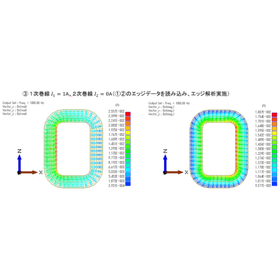
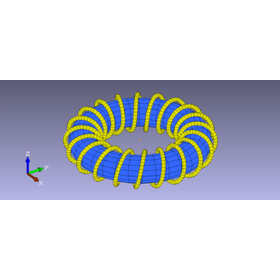
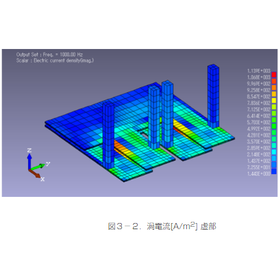
This is an introduction to a case study analyzing the magnetic flux density distribution, self-inductance, and mutual inductance of a transformer composed of primary and secondary windings and a magnetic circuit (iron core) when excited. The software "PHOTO-EDDYTMjω" was used. A current of 1A at a frequency of 1000Hz was applied to the primary and secondary windings. Additionally, the number of nodes was 18,118, and the number of elements was 13,648, with the shape modeled in three dimensions as a full model. [Case Overview] ■ Software Used: PHOTO-EDDYTMjω ■ Analysis Conditions - Model using iron core and primary/secondary windings - Applied a node current of 1A at 1000Hz to the primary and secondary windings *For more details, please refer to the related links or feel free to contact us.

  • image_23.png
  • image_26.png
  • image_27.png
  • image_28.png
  • image_29.png
  • Magnetic field analysis/electromagnetic wave analysis
  • Analysis Services
  • Contract Analysis
  • soft

Added to bookmarks

Bookmarks list

Bookmark has been removed

Bookmarks list

You can't add any more bookmarks

By registering as a member, you can increase the number of bookmarks you can save and organize them with labels.

Free membership registration

[Analysis Case] Inductance Analysis of a Solenoid with a Circular Core

The error in the analysis result is -1.69%! Analysis is possible with a conductor-only mesh, without the need for an air mesh.

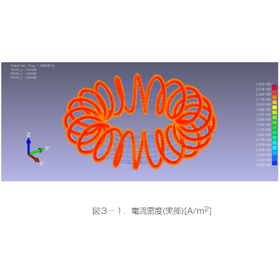
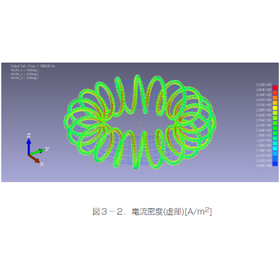
We will introduce the analysis results of current distribution (real part and imaginary part) and self-inductance. The mesh scale consists of 11,200 elements and 15,088 nodes. Using the magnetic field analysis module "PHOTO-EDDYTMjω," it is possible to analyze with a mesh of only conductors, eliminating the need for an air mesh. 【Case Overview】 ■ Software Used: PHOTO-EDDYTMjω ■ Analysis Conditions ・ Current Value: 1[A] ・ Frequency: 1000[Hz] *For more details, please refer to the related links or feel free to contact us.

  • image_24.png
  • image_25.png
  • image_30.png
  • Magnetic field analysis/electromagnetic wave analysis
  • Analysis Services
  • Contract Analysis
  • soft

Added to bookmarks

Bookmarks list

Bookmark has been removed

Bookmarks list

You can't add any more bookmarks

By registering as a member, you can increase the number of bookmarks you can save and organize them with labels.

Free membership registration

[Analysis Case] Inductance Analysis Between Conductors

Analyze the eddy currents flowing between two conductors! Using the frequency response magnetic field analysis software "PHOTO-EDDYTMjω".

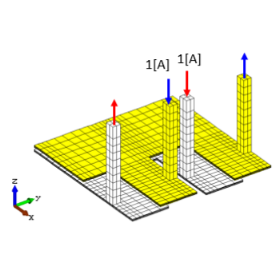
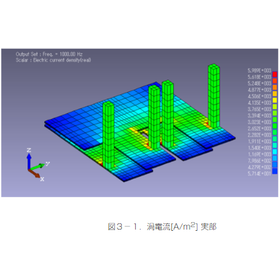
We will introduce the analysis results of eddy current distribution, self-inductance, and mutual inductance. The analysis was conducted for three cases: only conductor 1, only conductor 2, and both conductors 1 and 2 carrying current. The mesh scale consists of 3,200 elements and 4,800 nodes. Using the magnetic field analysis module "PHOTO-EDDYTMjω," it is possible to perform the analysis with a mesh of only the conductors, eliminating the need for air mesh. [Case Overview] ■ Software Used: PHOTO-EDDYTMjω ■ Analysis Conditions - Current Value: 1[A] - Material Properties: Relative Permeability 1.0, Electrical Conductivity 1.0×10^6[S/m] - Frequency: 1.0[kHz] *For more details, please refer to the related links or feel free to contact us.

  • image_17.png
  • image_01.png
  • image_02.png
  • Magnetic field analysis/electromagnetic wave analysis
  • Analysis Services
  • Contract Analysis
  • soft

Added to bookmarks

Bookmarks list

Bookmark has been removed

Bookmarks list

You can't add any more bookmarks

By registering as a member, you can increase the number of bookmarks you can save and organize them with labels.

Free membership registration

[Analysis Case] Electromagnetic Field Analysis of Wireless Power Transfer (Electromagnetic Induction Method)

Introduction of analysis examples of wireless power transmission using electromagnetic induction method.

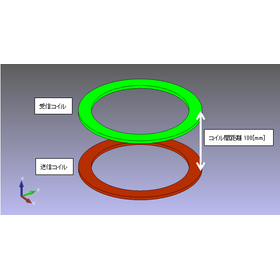
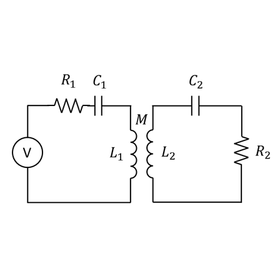
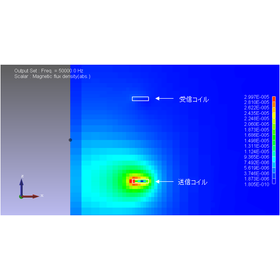
In recent years, research and development of wireless power transmission technology, which transmits power wirelessly, has been conducted. First, as a basic model, we consider two coils as shown in the left diagram. The transmitting coil and the receiving coil are arranged vertically, and circuit elements are connected to the coils. On our company website, we introduce analysis examples of wireless power transmission using electromagnetic induction. For more details, please refer to the related links below. 【Case Overview】 ■ Software Used: PHOTO-EDDYjω ■ Analysis Results ・Self Inductance: 358.7 [uH] ・Mutual Inductance: 38.4 [uH] *For more details, please check the related links or feel free to contact us.

  • 2022-11-21_15h26_01.png
  • 2022-11-21_15h26_06.png
  • 2022-11-21_15h26_10.png
  • 2022-11-21_15h26_15.png
  • 2022-11-21_15h26_20.png
  • 2022-11-21_15h26_32.png
  • Magnetic field analysis/electromagnetic wave analysis
  • Analysis Services
  • Contract Analysis
  • soft

Added to bookmarks

Bookmarks list

Bookmark has been removed

Bookmarks list

You can't add any more bookmarks

By registering as a member, you can increase the number of bookmarks you can save and organize them with labels.

Free membership registration

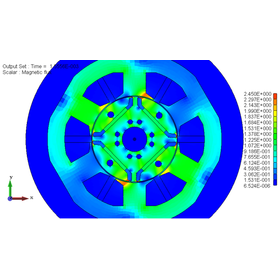
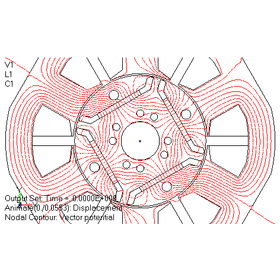
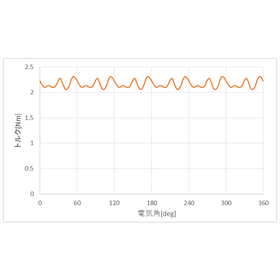
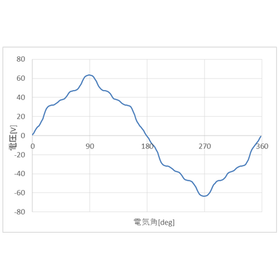
[Analysis Case] Magnetic Field Analysis of Concentrated Winding IPM Motor

The electromagnetic steel sheet uses a B-H curve equivalent to 35A300! The benchmark model employs a concentrated winding stator.

IPM motors have a structure in which magnets are embedded in the rotor, allowing for the utilization of both magnetic torque and reluctance torque, making them widely used as high-efficiency motors. In this analysis, we examined the induced voltage in an unloaded state and the torque waveform under load conditions. The magnets are input with a magnetization vector, and the coil current is input as current density. The current density is set with a time point sequence of a three-phase AC waveform. By setting the rotational speed at the nodes that make up the rotor, rotation is taken into account. [Case Overview] ■ Analysis Type: 2D Nonlinear Magnetic Field Analysis ■ Software Used: PHOTO-MAG *For more details, please refer to the related links or feel free to contact us.

  • 2022-11-21_15h56_57.png
  • 2022-11-21_15h57_04.png
  • 2022-11-21_15h57_12.png
  • 2022-11-21_15h57_18.png
  • 2022-11-21_15h57_23.png
  • Magnetic field analysis/electromagnetic wave analysis
  • Analysis Services
  • Contract Analysis
  • soft

Added to bookmarks

Bookmarks list

Bookmark has been removed

Bookmarks list

You can't add any more bookmarks

By registering as a member, you can increase the number of bookmarks you can save and organize them with labels.

Free membership registration

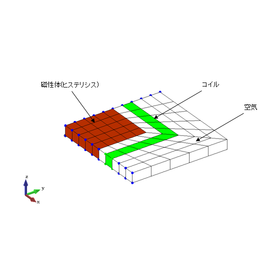
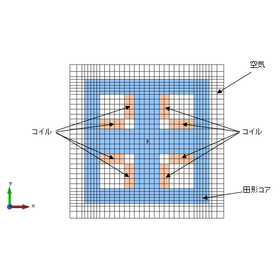
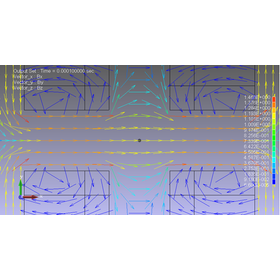
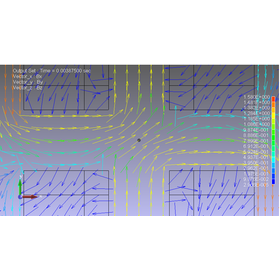
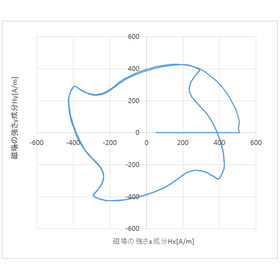
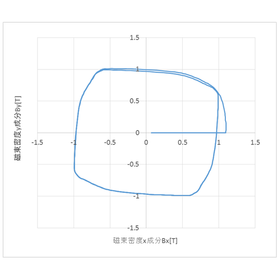
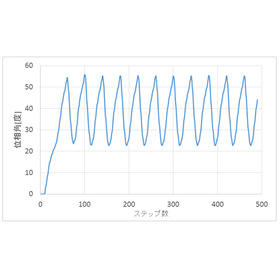
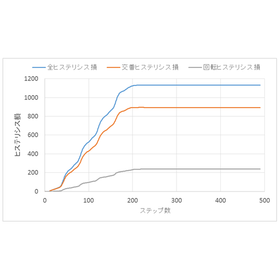
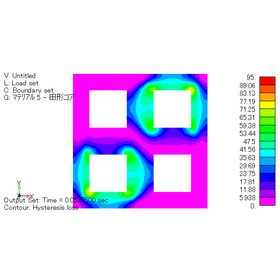
[Case Study] Magnetic Field Simulation Considering Hysteresis

The input method is simple and user-friendly! We will also introduce examples of investigating the behavior of hysteresis in a rotating magnetic field.

The "hysteresis model using free energy" developed by our company incorporates the free energy of magnetic materials obtained through thermodynamic considerations and the movement of magnetic walls as a friction model. This approach is based on physics rather than a mathematical model. Methods such as ICCG and Newton-Raphson can be directly utilized, allowing for improved representation of hysteresis curves, including minor loops, and enabling vectorization (magnetic anisotropy). In the calculation examples using this method, we will verify whether hysteresis curves that can be expressed mathematically can be reproduced through simulation. We focused on analyzing a single component. If you are interested in magnetic field analysis considering hysteresis, please feel free to contact us. [Case Summary] ■ Software Used: PHOTO-MAG *For more details, please refer to the PDF document or feel free to contact us.

  • 2022-11-21_16h06_12.png
  • 2022-11-21_16h06_19.png
  • 2022-11-21_16h06_25.png
  • 2022-11-21_16h06_31.png
  • 2022-11-21_16h06_37.png
  • 2022-11-21_16h06_42.png
  • 2022-11-21_16h06_49.png
  • 2022-11-21_16h06_57.png
  • 2022-11-21_16h07_03.png
  • Magnetic field analysis/electromagnetic wave analysis
  • Analysis Services
  • Contract Analysis
  • soft

Added to bookmarks

Bookmarks list

Bookmark has been removed

Bookmarks list

You can't add any more bookmarks

By registering as a member, you can increase the number of bookmarks you can save and organize them with labels.

Free membership registration

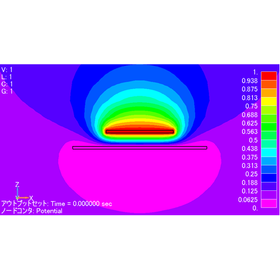
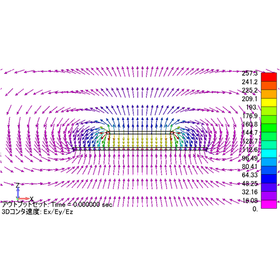
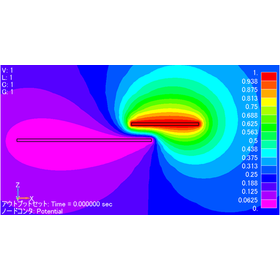
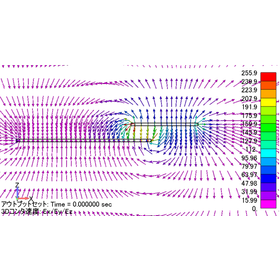
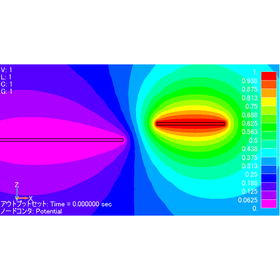
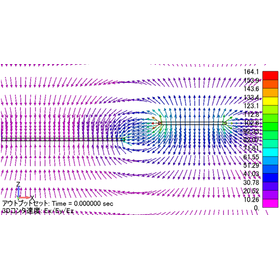
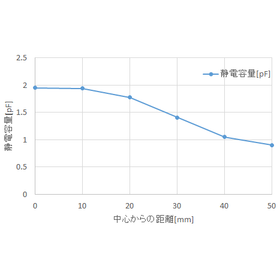
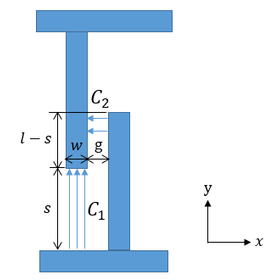
[Analysis Case] Electric Field Simulation of Capacitive Sensors

The software used is PHOTO-VOLT or VOLTjω! Move the electrodes based on the detection body for analysis.

There is a capacitive proximity switch that can detect both metal and non-metal objects without contact. This sensor detects objects by converting changes in capacitance into electrical signals. In this case study, we will analyze the capacitance between a grounded detection object (metal) and the electrodes within the sensor. We will also observe the changes in capacitance when the relative position of the electrodes is altered from the perspective of the detection object. 【Case Overview】 ■Software Used: PHOTO-VOLT or VOLTjω ■Analysis Type: 3D Electric Field Analysis *For more details, please refer to the related links or feel free to contact us.

  • 2022-11-21_16h35_06.png
  • 2022-11-21_16h35_12.png
  • 2022-11-21_16h35_22.png
  • 2022-11-21_16h35_30.png
  • 2022-11-21_16h35_38.png
  • 2022-11-21_16h35_44.png
  • 2022-11-21_16h35_52.png
  • 2022-11-21_16h35_59.png
  • Magnetic field analysis/electromagnetic wave analysis
  • Analysis Services
  • Contract Analysis
  • soft

Added to bookmarks

Bookmarks list

Bookmark has been removed

Bookmarks list

You can't add any more bookmarks

By registering as a member, you can increase the number of bookmarks you can save and organize them with labels.

Free membership registration

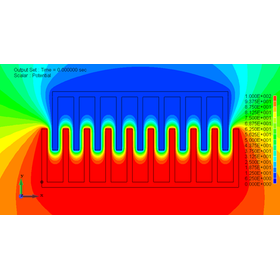
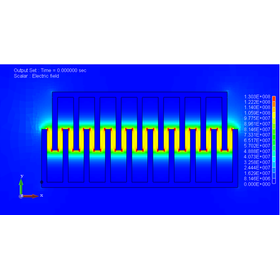
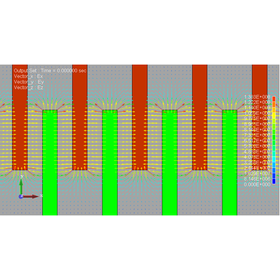
[Analysis Case] Electric Field Analysis of MEMS Electrostatic Actuators (Electrostatic Force)

Consideration of whether the order of the electrostatic force obtained as a result of the analysis is reasonable! A case study applying electric field analysis.

Here is an example of electric field analysis for a comb-type electrostatic actuator. Electrostatic actuators generate electrostatic force based on the sign of the charges present on opposing electrodes, so electric field analysis is applied. In "PHOTO-VOLT," it is possible to calculate the potential distribution, electric field distribution, and the electrostatic force acting on the electrodes. Additionally, we consider whether the order of the electrostatic force obtained from the analysis results is reasonable. For more details, please refer to the related links below. 【Case Overview】 ■ Software Used: PHOTO-VOLT ■ Analysis Results ・Electrostatic Force (per unit length): 0.792[N] *For more details, please refer to the related links or feel free to contact us.

  • 2022-11-21_16h48_58.png
  • 2022-11-21_16h49_03.png
  • 2022-11-21_16h49_10.png
  • 2022-11-21_16h49_20.png
  • Magnetic field analysis/electromagnetic wave analysis
  • Contract Analysis
  • Analysis Services
  • soft

Added to bookmarks

Bookmarks list

Bookmark has been removed

Bookmarks list

You can't add any more bookmarks

By registering as a member, you can increase the number of bookmarks you can save and organize them with labels.

Free membership registration

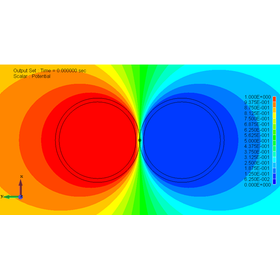
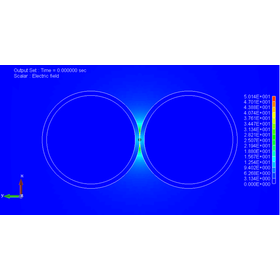
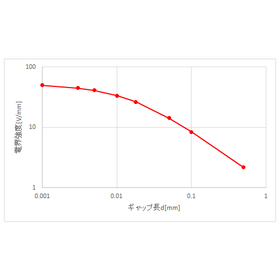
[Analysis Case] Electric Field Analysis Between Coil Wires (Discharge)

An analysis case of the electric field generated when a voltage is applied between insulated coil wires (cables).

When a high voltage is applied to a coil, as in the case of surge voltage, a locally high electric field is generated, leading to discharge and damage to the coil's insulation. In this case, we analyze the electric field generated when a voltage is applied between insulated coil wires (cables). The electric field strength generated per 1[V] of voltage between the coil wires can be multiplied by the magnitude of the actual applied voltage to consider it as the maximum electric field strength. Please feel free to consult us regarding any concerns about electromagnetic field analysis. 【Case Overview】 ■ Software Used: PHOTO-VOLT *For more details, please refer to the related links or feel free to contact us.

  • 2022-11-21_17h05_37.png
  • 2022-11-21_17h05_42.png
  • 2022-11-21_17h05_49.png
  • 2022-11-21_17h05_55.png
  • 2022-11-21_17h06_01.png
  • Magnetic field analysis/electromagnetic wave analysis
  • Contract Analysis
  • Analysis Services
  • soft

Added to bookmarks

Bookmarks list

Bookmark has been removed

Bookmarks list

You can't add any more bookmarks

By registering as a member, you can increase the number of bookmarks you can save and organize them with labels.

Free membership registration

[Analysis Case] Induction Heating Analysis of IH Heaters

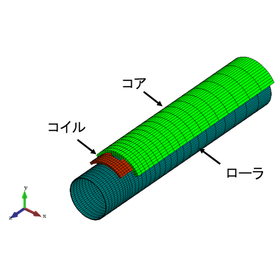
The positions of the magnetic core and coil are fixed! We will introduce an analysis case considering the rotation of the roller!

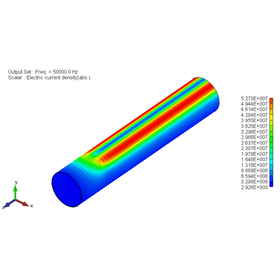
Copiers and printers utilize electrophotographic technology. In the electrophotographic process, the steps of "charging," "exposure," "development," "transfer," and "fixing" are followed, leading to paper output. Fixing is the process of solidifying the toner on the paper using heat and pressure. In fixing, energy efficiency and reduced warm-up time are required, and IH technology is used as a heating method. In this case, the heat generation density distribution obtained through magnetic field analysis is used in thermal conduction analysis to analyze the temperature distribution of the roller. The positions of the magnetic core and coil are fixed, and the analysis takes into account the rotation of the roller. For more details, please refer to the related links below. 【Case Overview】 ■ Analysis Type: 3D Analysis ■ Analysis Module: PHOTO - EDDYjω & THERMO *For more details, please refer to the related links or feel free to contact us.

  • 2022-11-21_17h31_56.png
  • 2022-11-21_17h32_02.png
  • 2022-11-21_17h32_06.png
  • 2022-11-21_17h32_12.png
  • 2022-11-21_17h32_17.png
  • 2022-11-21_17h32_22.png
  • 2022-11-21_17h32_48.png
  • Magnetic field analysis/electromagnetic wave analysis
  • Contract Analysis
  • Analysis Services
  • soft

Added to bookmarks

Bookmarks list

Bookmark has been removed

Bookmarks list

You can't add any more bookmarks

By registering as a member, you can increase the number of bookmarks you can save and organize them with labels.

Free membership registration

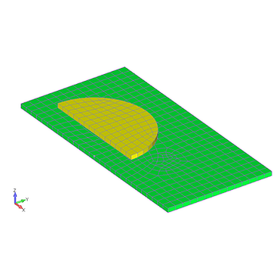
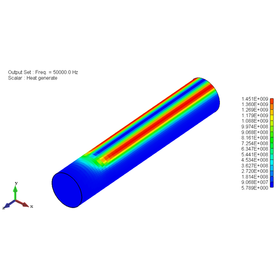
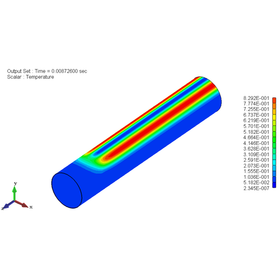
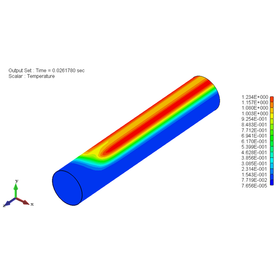
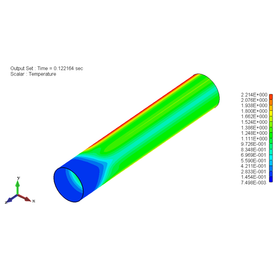
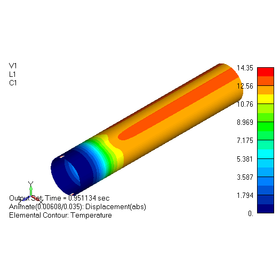
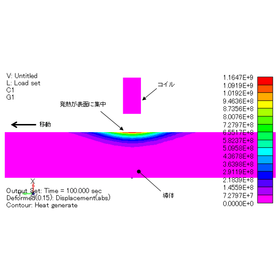
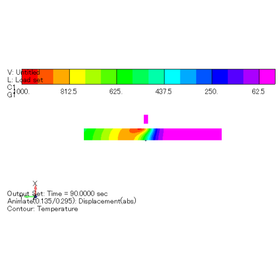
[Analysis Case] Induction Heating Analysis of a Cylindrical Conductor

Finite element method-based magnetic field-thermal coupled analysis is effective for understanding heat distribution and temperature distribution!

This is an example of heating the entire cylindrical conductor by moving it and using induction heating. By passing through the center of a coil connected to an AC power source, eddy currents flow on the surface of the conductor, generating heat. The temperature rises from the surface, and heat is conducted internally. Due to the axisymmetric shape of this model, it can be analyzed using 2D axisymmetric analysis. Therefore, plate elements are used. To understand the heat generation distribution and temperature distribution inside the cylindrical conductor, a magnetic-thermal coupled analysis using the finite element method is effective. [Case Overview] ■ Analysis Module: PHOTO - EDDYjω & THERMO *For more details, please refer to the related links or feel free to contact us.

  • 2022-11-21_17h38_04.png
  • 2022-11-21_17h38_10.png
  • Magnetic field analysis/electromagnetic wave analysis
  • Contract Analysis
  • simulator
  • soft

Added to bookmarks

Bookmarks list

Bookmark has been removed

Bookmarks list

You can't add any more bookmarks

By registering as a member, you can increase the number of bookmarks you can save and organize them with labels.

Free membership registration

[Analysis Case] Electromagnetic Field Analysis of Hollow Resonators

Perform eigenvalue analysis using a rectangular hollow resonator model to determine the resonance frequency and resonance modes (patterns of electric and magnetic fields).

Electromagnetic field analysis was conducted to determine the resonance frequency and resonance modes of a cavity resonator. In this case, a rectangular cavity resonator was modeled, and eigenvalue analysis was performed to obtain the resonance frequency and resonance modes (patterns of electric and magnetic fields). 【Case Overview】 ■ Software Used: PHOTO-WAVEjω ■ Analysis Results ・In Mode 1, the error compared to the theoretical value was only 0.104%.

  • Magnetic field analysis/electromagnetic wave analysis
  • Contract Analysis
  • Analysis Services
  • soft

Added to bookmarks

Bookmarks list

Bookmark has been removed

Bookmarks list

You can't add any more bookmarks

By registering as a member, you can increase the number of bookmarks you can save and organize them with labels.

Free membership registration

Software "Lighting Simulator CAD"

Easy operation and high precision. Also supports CAD data import!

"Lighting Simulator CAD" is an easy-to-use lighting simulator that allows for the evaluation of lighting optical systems with high precision. It is a purely domestic and affordable software. Additionally, it supports 3D CAD import (IGES, STL, STEP files). 【Features】 ■ Realization of CAD data import ■ Non-sequential tracking capability ■ User-friendly interface ■ High calculation accuracy and reliability for serious users ■ Comprehensive support system *For more details, please refer to the external link page or feel free to contact us.

  • Other lighting equipment
  • soft

Added to bookmarks

Bookmarks list

Bookmark has been removed

Bookmarks list

You can't add any more bookmarks

By registering as a member, you can increase the number of bookmarks you can save and organize them with labels.

Free membership registration

[Mathematica Introduction Case Study] Application to Quantitative Analysis of Biological Shapes

Introducing examples of seamless visualization in 2D and 3D.

To the Department of Biological Sciences, Graduate School of Science, Kyushu University, we would like to introduce a case study of the implementation of "Mathematica." We utilize this product for analyzing and processing formulas, as well as for visualization in the analysis of organized models that describe forms and shapes. Through formula processing, we are able to advance the analysis while maintaining versatility, and we have received feedback that it is convenient to confirm what kind of "shape" or growth pattern is actually demonstrated based on specific parameter values. 【Attractions of the Product】 ■ It supports a wide variety of data formats and allows for seamless visualization in both 2D and 3D. *For more details, please download the PDF or feel free to contact us.

  • Software (middle, driver, security, etc.)
  • soft

Added to bookmarks

Bookmarks list

Bookmark has been removed

Bookmarks list

You can't add any more bookmarks

By registering as a member, you can increase the number of bookmarks you can save and organize them with labels.

Free membership registration

[Mathematica Introduction Case] Failure Prediction

An example where building and training a network model could be easily executed with a short program.

At Kanagawa University, Faculty of Engineering, Department of Management Engineering, we will introduce a case study on the implementation of 'Mathematica' in reliability engineering. This product is utilized for statistical analysis and numerical calculations. It is highly valued due to its extensive implementation of probability distributions such as CopulaDistribution, and it is used for solving equations and mathematical optimization functions when searching for the probability distribution that best fits the data. Additionally, it is noted that there are plans to consider its use in education in the future. [Results] - Not only is the implementation of probability distributions comprehensive, but the functions for engineering analysis, such as reliability analysis, are also well-developed and very useful. - The construction of network models and learning processes can be easily executed with short programs, which is very helpful. *For more details, please download the PDF or feel free to contact us.

  • Software (middle, driver, security, etc.)
  • soft

Added to bookmarks

Bookmarks list

Bookmark has been removed

Bookmarks list

You can't add any more bookmarks

By registering as a member, you can increase the number of bookmarks you can save and organize them with labels.

Free membership registration

[IGOR Pro Case Study] Semiconductor Quantum Dot Light Source for Quantum Cryptography Communication

Examples of applications used in a wide range of areas such as graph creation, matrix calculations, and numerical solutions of simultaneous differential equations.

We would like to introduce a case where 'IGOR Pro' has been implemented at the Research Institute for Electronic Science, Hokkaido University, in the field of Nano-Optical Functional Materials. The product is utilized for a wide range of applications including organizing experimental data, analysis, fitting, convolution integrals using instrumental functions, simulations (including custom programs), graph creation, matrix calculations, and numerical solutions of simultaneous differential equations. It integrates data organization, advanced analysis, graph plotting, and programming, which means that in most cases, there is no need to use other software, making it a very effective tool, as we have received feedback. 【Reason for Implementation】 ■ It can process everything from loading acquired data to extracting values through fitting, and instantly create high-quality graphs suitable for presentations at conferences. *For more details, please download the PDF or feel free to contact us.

  • 16-2.PNG
  • 16-3.PNG
  • 16-4.PNG
  • Software (middle, driver, security, etc.)
  • soft

Added to bookmarks

Bookmarks list

Bookmark has been removed

Bookmarks list

You can't add any more bookmarks

By registering as a member, you can increase the number of bookmarks you can save and organize them with labels.

Free membership registration

[IGOR Pro Case Study] Evaluation and Verification of Transmission Characteristics

Examples of the execution of transmission simulations and the display and analysis of results.

We would like to introduce a case where "IGOR Pro" has been implemented at Koyama College of Technology. The product was introduced due to its convenient environment that allows for data loading, programming, and analysis all in one, as well as its robust graphing capabilities. It is utilized for analyzing frequency characteristic data of measured printed circuit board wiring, graphing, and executing transmission simulations based on the measured characteristics, along with displaying and analyzing the results. 【User Experience of the Product】 ■ Rich functions and graphing capabilities ■ The "File Save" feature allows for saving the workflow of previous tasks, enabling a return to the exact state at the time of saving for the next session ■ With basic knowledge of programming in C language, it is relatively easy to develop advanced analysis programs by applying the built-in functions ■ Compared to programming in C language, handling matrices and complex numbers is easier *For more details, please download the PDF or feel free to contact us.

  • 18-2.PNG
  • Software (middle, driver, security, etc.)
  • soft

Added to bookmarks

Bookmarks list

Bookmark has been removed

Bookmarks list

You can't add any more bookmarks

By registering as a member, you can increase the number of bookmarks you can save and organize them with labels.

Free membership registration

SMART Lab

It can be easily operated with a user-friendly interface!

The "SMART Lab" is a comprehensive software solution that combines accurate vibration detection and analysis with intuitive operation. By simplifying the measurement process and providing advanced tools for detailed data analysis, it guarantees precise results. Additionally, using this product in conjunction with SMART series devices allows you to fully unleash its potential. Synchronized data from different devices can be processed simultaneously, enabling unparalleled flexibility in measurement setup. 【Features】 ■ One software for all devices ■ Measurement compatible with 3D models ■ Advanced collection and analysis *For more details, please download the PDF or feel free to contact us.

  • ?SMART Lab 画像2.jpg
  • ?SMART Lab 画像3.jpg
  • Other analyses
  • soft

Added to bookmarks

Bookmarks list

Bookmark has been removed

Bookmarks list

You can't add any more bookmarks

By registering as a member, you can increase the number of bookmarks you can save and organize them with labels.

Free membership registration

Room Pressure Concentration Controller "PGC1" [Manage room pressure control devices all in one!]

Manage multiple room pressure control devices collectively!

The "PGC1" is a centralized room pressure controller that can manage multiple Okaya Seiritsu Kogyo room pressure control devices together. It allows for remote management of control parameter changes for room pressure control devices, acquisition of current room pressure values, and confirmation of alarm statuses. Previously, it was necessary to go up to the ceiling space, but now it can be monitored remotely from the machine room, eliminating the need to access the ceiling space and improving work efficiency. Additionally, it enables the miniaturization of control panels and reduces wiring and piping work. 【Advantages of Implementation】 ■ Improved work efficiency through remote monitoring ■ Miniaturization of control panels ■ Communication possible with just wiring *For more details, please download the PDF or feel free to contact us.

  • 室圧集中コントローラ2.png
  • 室圧集中コントローラ3.png
  • 室圧集中コントローラ4.png
  • 室圧集中コントローラ5.png
  • Room Pressure Control
  • soft

Added to bookmarks

Bookmarks list

Bookmark has been removed

Bookmarks list

You can't add any more bookmarks

By registering as a member, you can increase the number of bookmarks you can save and organize them with labels.

Free membership registration

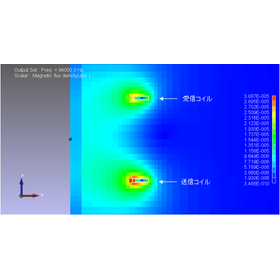
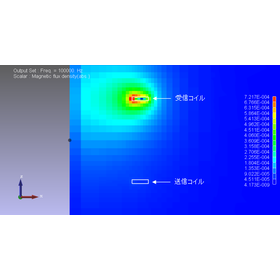
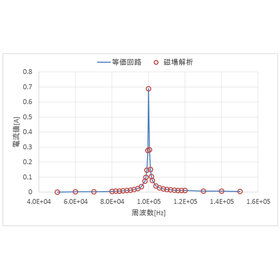
Material "New Eddy Current Equivalent Circuit Method" *Free distribution ongoing

Overview of the new eddy current equivalent circuit method (CLN equivalent circuit method) and analysis examples.

This document introduces a new eddy current equivalent circuit method (CLN equivalent circuit method) developed by our company. The CLN equivalent circuit method is a type of model order reduction, based on a new technique that utilizes the orthogonalization of predetermined functions, similar to the mode synthesis method. The conductor shape is represented by a mesh, but unlike conventional FEA, it determines the resistance and inductance of the ladder circuit by alternately performing static magnetic field and static electric field analyses. Additionally, by coupling the ladder circuit with electrical circuits and control circuits, it is possible to solve the eddy current field, including skin effect and proximity effect. 【Features】 ■ Equivalent circuits that include frequency dependence can be obtained in less computation time than conventional methods. ■ Not only frequency domain simulations but also time domain simulations are possible. ■ Conductors can be created using meshes and analyzed with FEA. ■ It is possible to achieve the same computational accuracy at a lower computational cost than conventional FEA circuit coupling analyses. *For more details, please refer to the PDF document or feel free to contact us.

  • Magnetic field analysis/electromagnetic wave analysis
  • Contract Analysis
  • simulator
  • soft

Added to bookmarks

Bookmarks list

Bookmark has been removed

Bookmarks list

You can't add any more bookmarks

By registering as a member, you can increase the number of bookmarks you can save and organize them with labels.

Free membership registration

EMSolution-Lite

Introduction to 2D Electromagnetic Field Analysis Software

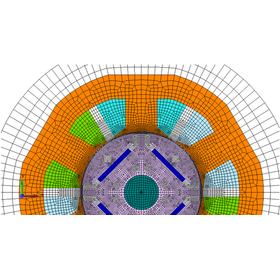
EMSolution-Lite is a budget version of EMSolution (electromagnetic field analysis) specifically designed for two-dimensional analysis. While the analysis model is limited to two dimensions, it allows users to utilize most of EMSolution's features (equivalent to the Professional package) for models with up to 100,000 elements. It was created in response to users' demands for an easy way to perform two-dimensional electromagnetic field analysis. For example, it can perform no-load analysis of PM motors as well as PWM voltage source analysis. Additionally, it can analyze the slip-torque characteristics of induction motors. Circuit and motion coupling analysis for electromagnets and actuators is also possible. We encourage you to use it for two-dimensional analysis and parameter surveys of motors, actuators, and more.

  • Magnetic field analysis/electromagnetic wave analysis
  • simulator
  • soft

Added to bookmarks

Bookmarks list

Bookmark has been removed

Bookmarks list

You can't add any more bookmarks

By registering as a member, you can increase the number of bookmarks you can save and organize them with labels.

Free membership registration

[Analysis Case] Transformer

Introducing analysis cases of EMSolution! Detailed information on transformer analysis.

This document presents a case study on the analysis of "transformers." It provides a detailed explanation of transformer analysis, as well as load analysis results. 【Contents】 ■Introduction ■Transformer Analysis ・Fig.1 Transformer Finite Element Mesh: 1/4 Model and COIL ・Fig.2 No-load Analysis Electrical Circuit ・Fig.3 No-load Analysis Primary Current Waveform ・Fig.4 No-load Analysis Secondary Voltage Waveform ・Table 1 No-load Analysis Results ・Table 2 Load Analysis Results, etc. *For more details, please refer to the PDF document or feel free to contact us.

  • Magnetic field analysis/electromagnetic wave analysis
  • Contract Analysis
  • Analysis Services
  • soft

Added to bookmarks

Bookmarks list

Bookmark has been removed

Bookmarks list

You can't add any more bookmarks

By registering as a member, you can increase the number of bookmarks you can save and organize them with labels.

Free membership registration