Time Series Data Analysis with Statistical Software JMP - Visualizing, Analyzing, and Forecasting Business Data
 SAS Institute Japan JMP Japan Division
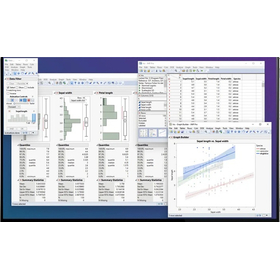
Many of the data handled by companies, such as sales, inventory levels, and sensor measurements, are recorded over time as "time series data." The situations in which such data is handled have been increasing in recent years. In this seminar, we will use real time series data as a subject to explain everything from visualization of time series data to quantification of factors through regression, forecasting using time series models, and What-if analysis, with demonstrations included.
In regression, it is important to pay attention to the points where previous and subsequent values are related (autocorrelation), but by using time series models that leverage this characteristic, accurate predictions can be made. You will gain tips unique to JMP on how to handle this data and insights on how to utilize business data for forecasting and decision-making.
【Main Content】
Using real time series data as a subject, we will convey the following items with JMP demonstrations:
- The benefits and important considerations of analyzing time series data with JMP (date processing, lag functions, etc.)
- Visualization of time series data (considerations using line graphs and smoothing lines)
- Quantification of factors through regression models
- Future forecasting and What-if analysis using time series models (ARIMA, smoothing)
- Features and differentiation of JMP's platform for "Time Series Analysis" and "Time Series Forecasting"
| Date and time | Thursday, Aug 27, 2026 02:00 PM ~ 03:40 PM This is an online seminar using Zoom. |
|---|---|
| Entry fee | Free Advance registration is required. |
Inquiry about this news
Contact Us OnlineMore Details & Registration
Details & Registration