Maximizing Machine Operating Rate with MM (Man-Machine) Charts - A Field Improvement Method to Visualize Waste of People and Equipment on a Time Axis, Achieving Zero Waiting and Multi-Equipment Management.
 日本生工技研
This is a webinar for production technology, manufacturing site, and Kaizen personnel in the manufacturing industry.
Do you face any of the following challenges in your production line?
- Want to increase machine operating rates (minimizing downtime and waiting time)
- Not seeing waste in people and equipment (workers waiting, excessive setup and handling time)
- Want to promote multiple machine operation (multi-machine handling), but find it difficult to design process combinations
- Want to create an MM chart, but find it cumbersome to create and modify using Excel or handwritten methods, leading to poor adoption
The "MM chart (Man-Machine Chart / Combined Work Analysis Diagram)" aligns the movements of machines and operators on the same timeline, highlighting bottlenecks and wasted time, and is a classic method in Industrial Engineering.
In this seminar, we will clearly explain the basic way to view MM charts and the steps for utilizing them on-site, as well as introduce practical creation steps using the free web tool "InQross IE Chart," which significantly reduces the effort required for creation.
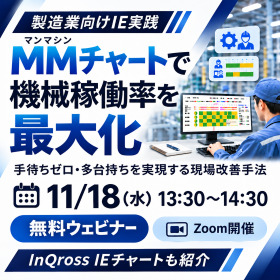
| Date and time | Wednesday, Nov 18, 2026 01:30 PM ~ 02:30 PM |
|---|---|
| Entry fee | Free |
Inquiry about this news
Contact Us OnlineMore Details & Registration
Details & Registration
Related product

Related catalog(1)

Distributors