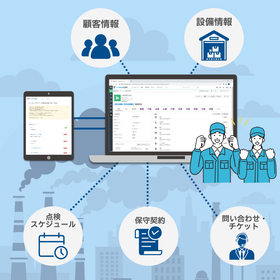
Data on sensor and equipment status displayed on an easily understandable digital signage screen.
i-Clip Viewer IoT is an IoT visualization system that collects data such as temperature and humidity, power consumption, production numbers, and equipment operating status, and displays it in real-time on a screen. 【Features】 - Create and modify screen layouts using Excel - Integrate with sensors, PLCs, contact signals, CSV, etc. - Change colors, switch screens, and send email notifications based on thresholds - Log acquired data for graphing and analysis - Display notifications and safety information on the same screen - On-premises operation without the need for cloud, one-time purchase model We support everything from sensor selection to data collection and screen design. Whether you are looking to start with IoT or want to utilize existing data, please feel free to consult with us.

Inquire About This Product
basic information
- Supported environment: Windows PC - Content creation: Microsoft Excel - Displayed content: Measurement values, equipment status, production information, notifications, images, videos, etc. - Operation methods: Automatic display, mouse operation, touch panel operation - Data integration: IoT devices, CSV files, etc. - Customization: Individual support for display screens, data acquisition, condition judgment, alert display, etc.
Price information
It varies depending on the requested system configuration, customization details, and distribution channels. Please consult with us.
Delivery Time
Applications/Examples of results
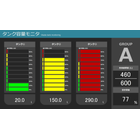
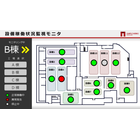
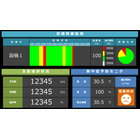
【Main Uses】 - Visualization of workplace environment such as temperature, humidity, CO2, and WBGT - Display of production numbers, progress rates, and takt times - Monitoring of equipment operating status, downtime, and abnormal conditions - Digitalization of stack lights, switches, and contact signals - Monitoring of power consumption, demand, and energy information - Display of CSV data output from existing systems or PLCs 【Examples of Use】 Collect operating information from multiple devices within the factory and display the status on an internal map. In the event of an anomaly, the screen automatically switches and notifications are sent via color changes or email. It also supports operations that save logs while displaying real-time measurements of temperature, humidity, and power, and can be used for trend graphs and daily report creation. If sensors are not installed, we will propose suitable equipment selection based on the intended use.
Detailed information
Company information

A pioneering manufacturer that was the first in the world to introduce vacuum fluorescent displays (VFD). In addition to displays with excellent visibility due to self-luminous elements, they offer a variety of electronic components, including touch LCDs that can be operated with thick gloves and EMI shield windows that adhere to the front of LCDs to prevent noise. Under the i-Products brand, they sell system products such as digital signage and electronic bulletin boards.