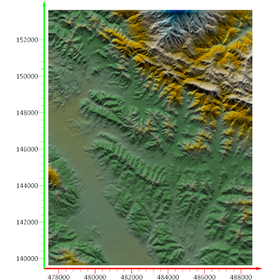
環境、水化学、資源・エネルギーの専門分野に特化した 2D & 3D グラフ作成ツール
------------------------------------------------------------ 複雑なデータを簡単に視覚化 ------------------------------------------------------------ 複雑なデータセットを理解することは難しいことです。Grapher はこの課題に真正面から取り組み、魅力的なグラフィカル表現を作成するための直感的なプラットフォームを提供します。Grapher があれば、複雑なデータセットを単純化し、アクセスしやすく理解しやすくすることができます。 業界プレゼンテーション用のプロットを作成する場合でも、クライアントの廃炉プロジェクトの四半期報告書を更新する場合でも、経時的な環境影響を分析する場合でも、複雑な情報を明確に伝えるだけでなく、正確かつエレガントに伝えることができます。
Inquire About This Product
basic information
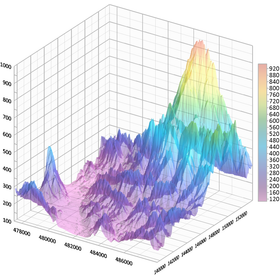
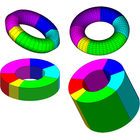
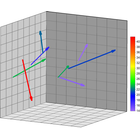
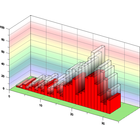
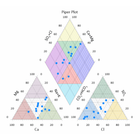
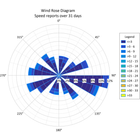
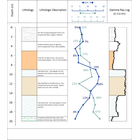
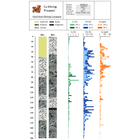
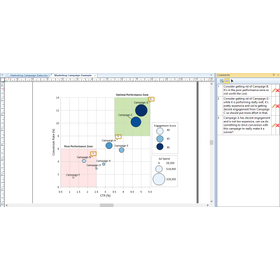
グラフオプション 高品質なグラフ作成ツールを使って、データを最大限に活用することができます。Grapher には地質学や水文学から環境研究や建設業まで、さまざまな業種に適した 80 種以上の 2D/3D グラフオプションが装備されています。 ■折れ線 / 散布図プロット Line (折れ線) Scatter (散布図) Line/Scatter (折れ線/散布図) Step (ステップ) Bubble (バブル) Class Scatter (分類散布図) 3D Ribbon (3D リボン) 3D Wall (3Dウォール) 3D Step (3D ステップ) XYZ Line/Scatter (XYZ 折れ線/散布図) XYZ Bubble (XYZ バブル) XYZ Class Scatter (XYZ 分類散布図) □機能一覧□ (ヒューリンクスのページへ) https://www.hulinks.co.jp/software/grapher/#function
Price information
□価格情報とお見積り依頼はこちら□ (ヒューリンクスのページへ) https://www.hulinks.co.jp/software/grapher/#price □トライアル□ デモ版申請フォーム(ヒューリンクスのページへ) https://www.hulinks.co.jp/contact/demo-request/?select-software=Grapher
Price range
P3
Delivery Time
P3
Applications/Examples of results
【Grapher ブログ】 情報を正しく伝え、見る人を納得させる棒グラフの作り方 – 効果的なカスタマイズ (ヒューリンクスのページへ) https://www.hulinks.co.jp/software/grapher/support/blog/p_59/
Detailed information
Line up(1)
| Model number | overview |
|---|---|
| 『Surfer』2D・3D地形図作成ソフトウェア | https://mono.ipros.com/product/detail/2000624185/ |
catalog(1)
Download All Catalogs
News about this product(1)
Company information

Even in a rapidly changing world, the philosophy of HuLinks has not changed since its founding. The greatness of humanity lies in our ability to think, create, and carve out a new tomorrow. We aim to contribute to society by providing carefully selected solutions that support this remarkable human ability—intellectual creation—while also offering a more comfortable environment and enhancing productivity.