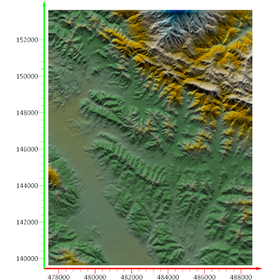
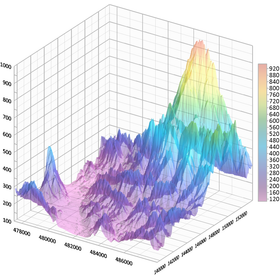
A 2D & 3D graph creation tool specialized in the fields of environment, water chemistry, and resources/energy.
------------------------------------------------------------ 1. Why Dedicated Graph Software in the Age of AI ------------------------------------------------------------ ■ In an Era Where AI Can "Draw Graphs" If you provide generative AI with data and ask it to "create a line graph," the code will be returned in seconds. In fact, simply giving it daily temperature data and asking it to "make a bar graph" or "overlay a 7-day moving average" will yield a reasonably accurate chart—this is the era we live in. —— Naturally, this raises a question. —— "If AI can do this much, is dedicated graph software still necessary?" This article introduces how to combine the automation of Grapher with AI, but before that, I would like to address this question directly. To conclude— the value of dedicated software is not "disappearing," but rather it is dividing into "replaced parts" and "aspects that stand out even more."
Inquire About This Product
basic information
AI and Grapher, the Best of Both Worlds - A New Way to Utilize Grapher 1. Why dedicated graphing software in the AI era? 2. Are you still doing that plotting manually every time? 3. Grapher Automation × AI - Mechanism and "Instructions in Japanese" 4. Practice: Just hand over the data and get the plot 5. Templates for "Mass Production × Format Standardization × Japanese Support" 6. "Not exposing data externally" × "Predictable costs" 7. Summary - Taking the best of AI and dedicated software □ For more details, click here □ (Go to the Hyulinks page) https://www.hulinks.co.jp/software/grapher/support/grapher_ai/
Price information
□Price information and quotation requests here□ (Go to the Hulinks page) https://www.hulinks.co.jp/software/grapher/#price □Trial□ Demo version application form (Go to the Hulinks page) https://www.hulinks.co.jp/contact/demo-request/?select-software=Grapher
Price range
P3
Delivery Time
P3
Applications/Examples of results
□Grapher Blog□ How to Create Bar Graphs that Accurately Convey Information and Persuade Viewers – Effective Customization (Go to the Hyolinks page) https://www.hulinks.co.jp/software/grapher/support/blog/p_59/ □Grapher New Features□ Template Function (Template Experience) — Create Polished, Publication-Quality Graphs More Quickly (Go to the Hyolinks page) https://www.hulinks.co.jp/software/grapher/support/template_experience/
Detailed information
-
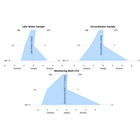
A plot specialized in Earth sciences unique to Grapher.
-
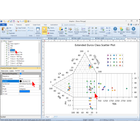
Just give instructions in Japanese to automate drawing with AI.
-
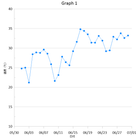
Just provide the data to create a diagram.
-
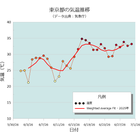
Mass production × Format standardization × Japanese language support
Line up(2)
| Model number | overview |
|---|---|
| "Grapher" specializes in creating 2D and 3D graphs. | https://mono.ipros.com/product/detail/2001652389/ |
| "Surfer" 2D/3D Terrain Mapping Software | https://mono.ipros.com/product/detail/2000624185/ |
catalog(1)
Download All Catalogs
News about this product(1)
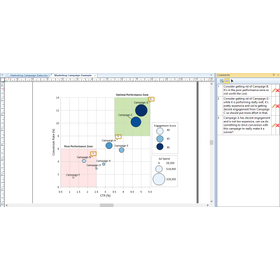
Company information

Even in a rapidly changing world, the philosophy of HuLinks has not changed since its founding. The greatness of humanity lies in our ability to think, create, and carve out a new tomorrow. We aim to contribute to society by providing carefully selected solutions that support this remarkable human ability—intellectual creation—while also offering a more comfortable environment and enhancing productivity.