Kintone plugin "Kindash+"
Kintone data, more freely and more clearly. From graphs and aggregation to analysis and daily report creation, all in one!
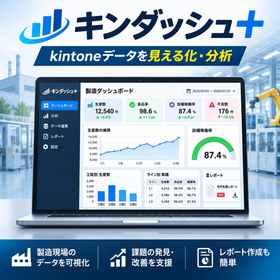
Kindash+ is a high-function dashboard plugin that visualizes data accumulated in kintone using a variety of graphs and summary tables, enabling analysis and report creation. It features a rich array of display components, including bar graphs, line graphs, pie charts, gauges, and pivot tables. You can freely arrange these components on the screen to create dashboards tailored to your needs. It supports data aggregation from multiple apps, calculation of metrics through arithmetic operations, filtering by specified periods, and detailed analysis through drill-through. Additionally, it allows for the creation of daily reports and documents that incorporate graphs. Kindash+ can be utilized for various business operations, including managing production performance, equipment utilization rates, and defect rates in manufacturing, as well as sales analysis, sales performance, and inventory management. Transforming data accumulated in kintone from "visualization" to "analysis and improvement," Kindash+ supports rapid decision-making based on data.
- Company:ミナテック
- Price:10,000 yen-100,000 yen