Kintone data, more freely and more clearly. From graphs and aggregation to analysis and daily report creation, all in one!
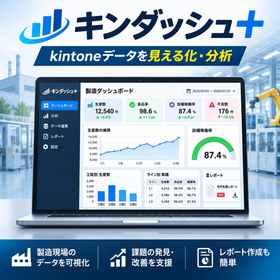
Kindash+ is a high-function dashboard plugin that visualizes data accumulated in kintone using a variety of graphs and summary tables, enabling analysis and report creation. It features a rich array of display components, including bar graphs, line graphs, pie charts, gauges, and pivot tables. You can freely arrange these components on the screen to create dashboards tailored to your needs. It supports data aggregation from multiple apps, calculation of metrics through arithmetic operations, filtering by specified periods, and detailed analysis through drill-through. Additionally, it allows for the creation of daily reports and documents that incorporate graphs. Kindash+ can be utilized for various business operations, including managing production performance, equipment utilization rates, and defect rates in manufacturing, as well as sales analysis, sales performance, and inventory management. Transforming data accumulated in kintone from "visualization" to "analysis and improvement," Kindash+ supports rapid decision-making based on data.
Inquire About This Product
basic information
【Product Form】 kintone dedicated plugin Displays a dashboard on the kintone record list screen Create screens and graphs without programming 【Graph and Display Functions】 Bar graphs, line graphs, area graphs, pie charts, donut charts Scatter plots, heat maps, waterfall charts, gauges Combination graphs, stacked graphs, time series graphs Pivot tables, cross-tabulation tables, data lists Numeric displays, labels, various display components 【Data Aggregation and Analysis Functions】 Data acquisition and aggregation from multiple kintone apps Aggregation by hour, day, week, month Data filtering by date and period specification Filtering by multiple conditions Calculation of custom metrics using arithmetic operations Comparison display of multiple data series Drill-through for checking detailed data 【Dashboard Editing Functions】 Free placement and resizing of display components Screen management with multiple tabs Settings for graph display format, color scheme, and display items Customization of dashboard layout 【Report and Document Functions】 Creation of daily reports and reports Placement of graph snapshots in documents A4 and A3 size document layouts
Price information
Kindash + Price Information Sales Price: 50,000 yen (excluding tax) / 1 license (one-time purchase) License Unit: 1 license per kintone environment (domain) Contract Type: One-time purchase Monthly/Annual Subscription Fee: Not required Trial version available
Price range
P2
Delivery Time
P3
Applications/Examples of results
Kindash+ can be widely used for visualizing, aggregating, and analyzing data accumulated in kintone. [Examples of Use in Manufacturing] Comparing production plans and actual results, analyzing trends in equipment utilization rates and defect rates, aggregating production numbers by process, and analyzing factors causing equipment downtime. By combining it with the kintone PLC connector 2, visualization of equipment and production data collected from PLCs can also be achieved. [Examples of Use in General Business] Analyzing sales and profits, managing sales performance, tracking inventory trends, comparing budgets and actual results, and managing various KPIs. [Forms and Reporting] Creating daily reports and reports using graphs and summary tables, comparing results by period, and supporting detailed analysis through drill-through. From the manufacturing site to management, it supports data-driven business improvement and rapid decision-making.
Detailed information
-
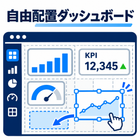
With Kintdash+, you can freely arrange a variety of graphs and display components to create an original dashboard. You can combine bar graphs, line graphs, pie charts, gauges, numerical displays, and summary tables, customizing their placement, size, color, and displayed content as you wish. You can retrieve data from multiple Kintone apps and consolidate various information such as production performance, equipment utilization rates, defect rates, and sales trends onto a single screen. It also supports tab switching by purpose, allowing you to build an easy-to-read dashboard tailored to your needs, from manufacturing sites to management.
-
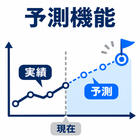
You can predict future figures from accumulated performance data and display both actual results and forecasts on the same graph. For example, you can visualize the end point if production continues at the current pace based on the production plan and actual production to date, as well as the forecasted time to achieve the planned quantity. By comparing forecast results based not only on the day's actual performance but also on the performance from the past 30 days or the past year, you can analyze changes in production equipment performance. This can be utilized not only for production management but also for sales forecasts and year-end performance estimates, supporting forward-looking decision-making and improvement activities.
-

KindaDash+ is equipped with a feature for creating daily reports and documents utilizing graphs and aggregated results. It allows you to compile data such as production performance, equipment utilization rates, and defect counts stored in kintone, and create easy-to-read reports that incorporate graphs and tables. It is also possible to place snapshots of dashboard graphs into the documents. It supports A4 and A3 size document layouts, which can be printed and used as meeting materials or daily reports on-site. This reduces the hassle of data transcription and graph creation that was traditionally done in Excel, supporting the efficiency of reporting tasks and information sharing.
catalog(1)
Download All Catalogs
Company information

Our company provides a comprehensive range of services related to the development of automatic control systems for factory automation, including "assembly, precision adjustment, and installation of machinery," "design of control panel housings and electrical circuits," "creation of control panels and wiring work for equipment," and "program development and trial operation adjustments for PLCs and robots." We also manufacture and sell modular products. Modular products are those that have necessary functions pre-installed in control panels and control boxes, allowing customers to complete the control panels and control boxes by only designing and constructing the required functions. Additionally, we sell IoT application products and offer proposals for IoT and digital transformation (DX). Our electrical design CAD supports a wide range of software, including ECAD DCX/dio, EPLAN, and Unidraf2010LT.