Search for products by classification category
Search for companies by industry
Added to bookmarks
Bookmark has been removed
You can't add any more bookmarks
By registering as a member, you can increase the number of bookmarks you can save and organize them with labels.
Contact this company
1~45 item / All 82 items
The electromagnetic field analysis software 'PHOTO-Series' is a simulation tool that can visualize magnetic field distributions and eddy current density distributions. Based on the governing equations of electromagnetic phenomena, the "Maxwell equations," it visualizes the strength and direction of electromagnetic fields. It can cover a wide range of areas, from low-frequency electric field analysis to high-frequency electromagnetic field analysis such as radio waves. One of the non-destructive testing methods for detecting defects, the eddy current deep flaw method, is also a subject of analysis. ★ We will conduct a demo version giveaway campaign. <Campaign Period> November 1, 2023 (Wednesday) to January 31, 2024 (Wednesday) <Demo Version Overview> ◎ You can try the program without any time restrictions. ◎ All functions except for the number of elements (or nodes) limitations are the same as the product version. <Target Audience> ◎ Those considering purchasing the product. ◎ Those who want to actually experience what the software is like. ◎ Those who want to confirm the operational feel or practice operations. This is a campaign that has been conducted in the past and received positive feedback. If you are interested, please contact us via the "Contact Us" button below.
The "PHOTO series" offers analysis solvers that utilize the most suitable simulation methods for a wide range of target fields, from high-frequency electromagnetic waves to low-frequency electric and magnetic fields, based on the analysis theme. Unlike other commercial software packages that handle all phenomena with a single analysis solver, we use the most appropriate analysis solver for the purpose, ensuring high analysis accuracy and detailed responsiveness to needs. Additionally, you can select only the necessary modules suited to the problem, which helps keep the implementation costs economical. It is also easy to expand functionality by adding modules, and by combining them, it is possible to handle coupled analyses such as heat generation due to eddy currents and stresses or deformations caused by electromagnetic forces. All products are compatible with three-dimensional problems, and the transient response analysis module can handle nonlinear materials.
The PHOTO series is a general-purpose electromagnetic field analysis software developed to simulate electromagnetic phenomena utilized in a wide range of fields using computers. Although electromagnetic phenomena can be broadly categorized, the application areas of electromagnetism are extensive, and various numerical analysis methods have been devised. Furthermore, in real product design, it is necessary to evaluate not only the electromagnetic field but also various derived phenomena. To address these issues, the PHOTO series adopts the following methods: - Provides optimal solvers tailored to various application areas, from high-frequency electromagnetic waves to low-frequency electric and magnetic fields. - Each solver is composed of program modules for different analysis methods, allowing the selection of numerical analysis techniques suitable for the problem at hand. - Enables coupled analysis execution through combinations of modules, such as electromagnetic fields with heat conduction, electromagnetic forces with structural deformation, and vibrations. - Offers a product configuration that allows the selection of efficient modules according to various problems. Our company provides these modules combined into products, assuming standard applications for our customers. If there is a request to build a special analysis system, we also accommodate customization based on these module groups.
The electromagnetic field analysis software "PHOTO-Series" is a simulation tool that can visualize magnetic field distributions and eddy current density distributions. It also analyzes the eddy current deep flaw detection method, which is one of the non-destructive testing methods for detecting the presence of defects. 【Features】 ● Each product is low-cost, allowing for the construction of systems composed of numerous modules, including coupled problems of electromagnetic field analysis, heat conduction, stress, and fluid analysis, at a low price. ● Each product is integrated with dedicated pre- and post-processing tools, equipped only with the necessary functions for electromagnetic field analysis, making it easy for beginners to operate smoothly. ● Academic pricing is available for use in educational institutions (half the regular price). ◆ If you are interested, please contact us via the 'Inquiry Form'.
The "PHOTO-EDDY+THERMO" or "PHOTO-EDDYjω+THERMO" is a specialized module for coupled analysis that combines magnetic field analysis and thermal conduction analysis. The transfer of heat generation density is automatically conducted without the need for files, allowing even beginners to confidently perform strong coupled analysis (bidirectional). 【Examples of Applications】 ◆ Quenching of gears through induction heating ◆ Induction heating analysis of steel plates (coupled analysis of magnetic field and heat) ◆ Analysis of induction heating, etc. 【For more details, please download the catalog or feel free to contact us】 ↓ ↓ ↓ ↓ ↓ ↓
The magnetic field and thermal coupled analysis system "PHOTO-Series" is a dedicated module for magnetic field-thermal coupled analysis that combines dynamic magnetic field analysis and thermal conduction analysis. Since the transfer of heat generation density is automatically performed without the need for files, even beginners can confidently conduct strong coupled analysis (bidirectional). 【Examples of Applications】 ◆ Quenching of gears by induction heating ◆ Induction heating analysis of steel plates (coupled analysis of magnetic field and heat) ◆ Analysis of induction heating, etc. 【For more details, please download the catalog or feel free to contact us】 ↓ ↓ ↓ ↓ ↓ ↓
3D High-Frequency Electromagnetic Field Analysis Software Using Finite Element Method (High-Frequency Electromagnetic Field Simulator) with a Module for Frequency Response Analysis ■□■Features■□■ ■Since it is integrated with the PHOTO series pre- and post-processing tools, data creation, analysis, and result processing can be performed as a continuous operation. ■It is integrated with other PHOTO series modules, allowing for easy coupled analysis, such as calculating temperature distribution from heat generation obtained through electromagnetic field analysis. ■A revolutionary speed-up has been achieved by combining the edge element method and ICCG method. Therefore, 3D electromagnetic wave analysis (high-frequency analysis) is now possible on a personal computer. ■Using the finite element method makes it suitable for analyzing closed regions, especially those involving multiple media. ■When coupled with the thermal conduction analysis software PHOTO-THERMO, it is possible to calculate temperature distribution from heat generation within dielectrics.
Electromagnetic field analysis was conducted to determine the resonance frequency and resonance modes of a cavity resonator. In this case, a rectangular cavity resonator was modeled, and eigenvalue analysis was performed to obtain the resonance frequency and resonance modes (patterns of electric and magnetic fields). 【Case Overview】 ■ Software Used: PHOTO-WAVEjω ■ Analysis Results ・In Mode 1, the error compared to the theoretical value was only 0.104%.
We conducted an analysis using the finite element method to determine the distribution of electromagnetic waves input from each port in a T-shaped waveguide used for signal processing in radar and other applications. Three ports were set up on an E-plane T-junction waveguide. Due to symmetry, a 1/2 model was created, with natural boundary conditions on the XY plane and symmetric boundary conditions on the other sides. As a result, the absolute values of S31 and S13 calculated were 0.644 and 0.631, respectively, with an error of 2.0%. [Case Summary] ■ Analysis Module: PHOTO-WAVEjω ■ Analysis Results - The absolute values of S31 and S13 calculated were 0.644 and 0.631, respectively, with an error of 2.0%. *For more details, please refer to the related links or feel free to contact us.
When a dielectric such as polyethylene is filled in a rectangular waveguide, reflections of electromagnetic waves occur at the air interface. Considering a system where polyethylene is filled in part of a rectangular waveguide of standard WRJ-5, the distribution of electromagnetic waves was analyzed using the finite element method. As a result, it was found that the absolute value of the electric field on the polyethylene side is constant, indicating that no reflection occurs at the output surface (the impedance boundary is correctly set). [Case Summary] ■ Analysis Module: PHOTO-WAVEjω ■ Analysis Results - It is evident that no reflection occurs at the output surface since the absolute value of the electric field on the polyethylene side is constant (the impedance boundary is correctly set). - In the calculation of the scattering matrix, the characteristic impedances of air and polyethylene were set as ZAir = 279.052Ω and ZPE = 156.987Ω. *For more details, please refer to the related links or feel free to contact us.
We will introduce a case study analyzing the input impedance of a dipole antenna using the electromagnetic wave analysis software "PHOTO-WAVEjω." The antenna has a diameter of 1mm, a length of 60.5mm, and a gap of 0.5mm. An impedance boundary was set at the model boundary. The antenna was treated as a perfect conductor. 【Case Overview】 ■ Software Used: PHOTO-WAVEjω ■ Analysis Conditions - An impedance boundary was set at the model boundary - The antenna was treated as a perfect conductor *For more details, please refer to the related links or feel free to contact us.
The Yagi-Uda antenna is a directional antenna composed of a waveguide made up of multiple short elements and a long element reflector, along with a feed located in between. The electromagnetic waves radiated from the feed are analyzed using the finite element method, and based on the results, far-field plane waves are estimated. The feed radiates electromagnetic waves polarized in the Z-axis direction, and the behavior of the electromagnetic waves in the air region surrounding the entire antenna is analyzed using the finite element method. Next, based on those results, the far-field electromagnetic waves are estimated using two different methods, and the results are compared. The shape is modeled as a full model. [Software Used] ■PHOTO-WAVEjω *For more details, please refer to the related links or feel free to contact us.
We present a case where the scattered wave in the far field, when a plane wave is incident on a scattering body and scattered, is estimated using the finite element method. A plane wave polarized in the X-axis direction is incident in the Z-axis direction, and the scattered wave after it hits the sphere is analyzed using the finite element method. Next, based on those results, we estimate the scattered wave in the far field using two different methods and compare the results. The shape is modeled in full. [Software Used] ■PHOTO-WAVEjω *For more details, please refer to the related links or feel free to contact us.
We will introduce a case study where metal posts were arranged to suppress the reflection of electromagnetic waves at 10GHz, and the frequency dependence of the reflection coefficient was analyzed. Impedance boundary conditions were set at the exit. The walls of the waveguide and the metal posts were treated as perfect conductors, and the input was provided as the TE10 electric field [V/m]. Additionally, an analysis was conducted for the case without metal posts for comparison. 【Case Overview】 ■ Software Used: PHOTO-WAVEjω ■ Analysis Conditions ・Waveguide: WRJ-10 (22.9mm × 10.2mm) ・The walls of the waveguide and the metal posts are perfect conductors ・The input was provided as the TE10 electric field [V/m] ・Impedance boundary conditions were set at the exit *For more details, please refer to the related links or feel free to contact us.
Photonic crystals are structures that can control light by periodically arranging multiple dielectrics and other materials. Electromagnetic wave analysis was conducted using the finite element method. The optical waveguide consists of periodically arranged dielectric rods, and light passes through areas where there are no dielectric rods. The radius of the rods, r, and the period of the rods, a, are set as r = 0.18a, and the electric field component parallel to the dielectric rods was input. 【Case Overview】 ■ Software Used: PHOTO-WAVEjω ■ Analysis Conditions - The radius of the rods, r, and the period of the rods, a, are set as r = 0.18a (Wavelength λ: 1.55μm, Refractive index n: 3.4) - Impedance boundary conditions are set on the sides - The electric field component parallel to the dielectric rods was input *For more details, please refer to the related links or feel free to contact us.
On this page, we introduce electromagnetic wave analysis animations of waveguides such as "Magic T," "E-plane T-junction waveguide," and "twisted waveguide." 【Overview】 ■ Magic T ■ E-plane T-junction waveguide ■ Twisted waveguide ■ Circular cavity ■ Rectangular iris-coupled waveguide filter *Detailed information about the cases can be viewed through the related links. For more information, please feel free to contact us.
The electromagnetic wave analysis of the waveguide using the slide interface assumes that the boundaries of the analysis target are surrounded by perfect conductors, and calculates the electromagnetic field inside the waveguide formed by the electric field input from the lower convex part. For more details, please download the catalog.
The analysis of electromagnetic waves in a parallel plate using a slide interface was conducted for plane waves propagating in an air region sandwiched between metal plates (infinite parallel plates, perfect conductors) arranged above and below. This analysis was performed using a non-connected mesh (hereafter referred to as a non-connected mesh) with the slide interface applied. For more details, please download the catalog.
In versions prior to Ver8.0 of "PHOTO-WAVEjω," it was necessary to set the electric field (3 components) at nodes or the current density (3 components) at elements as load conditions. Since Ver8.2, a feature has been added to automatically set these load conditions. Users can specify a set of nodes that are on the same plane, and by simply inputting a few parameters, the program calculates the electric field at each node and sets it as the load condition. [Issues] ■ In versions prior to Ver8.0 of "PHOTO-WAVEjω," it was necessary to set the electric field at nodes or the current density at elements as load conditions. ■ When setting the electric field in a rectangular waveguide, it was necessary to set each electric field component from the coordinates of each node, which was a cumbersome task for users. *For more details, please refer to the related links or feel free to contact us.
The number of nodes in the microwave analysis is 2494, and the number of elements is 1956. The analysis conditions are as follows: relative permittivity: real part: air 1, dielectric 40; imaginary part: air 0, dielectric -5; relative permeability: real part: air 1, dielectric 1; imaginary part: air 0, dielectric 0. For more details, please download the catalog.
The porous directional coupler is a coupler with numerous coupling holes created in two waveguides (WRJ-10) that share the E-plane, demonstrating good directionality over a wide bandwidth. We analyzed the electromagnetic waves within the waveguide when 10 GHz microwaves (TE10) were incident at the ports of the waveguide. The diameter of the holes is larger closer to the center, and the center positions of the holes are arranged at intervals of one-quarter of the wavelength within the tube. For more details, please download the catalog.
Analysis of two-dimensional axisymmetric and three-dimensional transient response of dynamic magnetic fields using the finite element method, considering motion (Dynamic Magnetic Field Simulator) ■□■Features■□■ ■Since it is integrated with other PHOTO series modules, coupled analysis, such as obtaining temperature distribution from heat generation calculated by electromagnetic field analysis, can be easily performed. ■A revolutionary speedup has been achieved by combining edge element method and ICCG method (dozens of times faster than conventional finite element methods). ■The use of the finite element method ensures stable solutions, making it user-friendly even for beginners. ■By incorporating a slide interface for two-dimensional, axisymmetric, and three-dimensional problems, the motion of objects can be easily handled. ■The motion of objects due to electromagnetic forces can be calculated in real-time by solving the equations of motion.
The analysis case of hinge-type electromagnetic relays requires mesh division of space in the finite element method. Therefore, handling the motion of objects in the finite element method has been considered a very difficult category of analysis, as it necessitates the manipulation of meshes, including spatial meshes. In the PHOTO-Series, we have newly developed a unique analysis function that automatically deforms the spatial mesh into an optimal shape according to the motion of the object, thereby solving this problem. For more details, please download the catalog.
The software for magnetic field analysis using the finite element method (magnetic field simulator) performs static analysis and transient response analysis. It can handle three-dimensional, two-dimensional, and axisymmetric problems. ■□■Features■□■ ■Since it is an integrated pre-post tool dedicated to the PHOTO series, data creation, analysis, and result processing can be performed as a series of operations. ■It is integrated with other PHOTO series modules, allowing for easy coupled analysis, such as deriving temperature distribution from heat generation obtained through electromagnetic field analysis. ■A revolutionary speedup has been achieved through the combined use of edge element method and ICCG method (tens of times faster than conventional finite element methods). ■The use of the finite element method ensures stable solutions, making it safe for beginners to use. ■When coupled with the thermal conduction analysis software PHOTO-THERMO, it is possible to calculate temperature distribution from Joule heating within conductors.
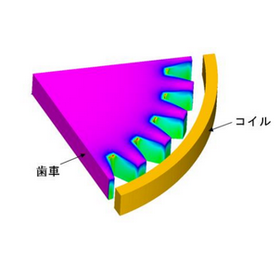
When a magnet is brought close to a gear made of a magnetic material, the distribution of the surrounding magnetic field changes depending on the position and rotation speed of the gear. A permanent magnet was placed near the rotating gear, and the changes in the surrounding magnetic field were analyzed. As a result, in the comparison of magnetic flux density due to rotation speed, the gear rotating at high speed exhibited a larger magnetic field along the edge of the gear, and a magnetic field due to eddy currents remained even when it was away from the magnet. 【Case Summary】 ■ Analysis Type: 3D Nonlinear Transient Magnetic Field Analysis ■ Analysis Module: PHOTO-EDDY *For more details, please refer to the related links or feel free to contact us.
Models that describe superconductors include the critical state model and the Kim model. The critical state model is a physical model that assumes a balance between the Lorentz force acting on the vortices and the pinning force caused by impurities inside the superconductor. In "PHOTO-EDDY," users can specify the constitutive equations, allowing for analysis not only with a constant Jc but also with the Kim model, where Jc depends on the magnetic flux density. The choice of which equations to use is up to the user. While care must be taken regarding the convergence of calculations, a high degree of freedom in input methods is available. 【Case Overview】 ■ Software Used: PHOTO-EDDY ■ Analysis Results - The superconductor was modeled using the critical state model, with a critical current density Jc of 1.0×10^9 [A/m²]. - When in a hollow core, the input current was adjusted so that the magnetic flux density at the center of the coil reached a maximum of 5 [T]. *For more details, please refer to the PDF document or feel free to contact us.
Induction machines that utilize electromagnetic induction are used in home appliances, escalators, and trains. Since eddy currents flow in induction machines, magnetic field analysis is necessary. The subject is a squirrel-cage three-phase induction motor, and considering the rotation of the rotor, the torque waveform during steady operation is analyzed. The analysis model is based on the benchmark model (K model) for induction motors from the Electrical Engineering Society's investigation committee. 【Case Overview】 ■ Analysis Type: 2D Nonlinear Transient Magnetic Field Analysis ■ Analysis Module: PHOTO-EDDY *For more details, please refer to the related links or feel free to contact us.
We will introduce an analysis case of the electromagnetic force (Lorentz force) acting on eddy currents. Using the software "PHOTO-EDDY," we created a 1/4 model based on the symmetry of the shape. As a result, it was confirmed that the input current becomes 0 at 1.5 [μsec], but the Lorentz force continues to occur beyond 1.5 [μsec]. 【Case Overview】 ■ Software Used: PHOTO-EDDY ■ Analysis Results - It was confirmed that the magnetic flux density is concentrated on the surface due to the skin effect. - The input current becomes 0 at 1.5 [μsec], but it was confirmed that the Lorentz force continues to occur beyond 1.5 [μsec]. *For more details, please refer to the related links or feel free to contact us.
The calculation of electromagnetic force in the plunger model was performed for the plunger model proposed by the Institute of Electrical Engineers for electromagnetic force verification, where the electromagnetic force acting on the center pole and the magnetic flux density of each part of the model were calculated when current was passed through the coil. For more details, please download the catalog.
The number of nodes for the analysis of the thin film head is 65,670, and the number of elements is 61,089. The analysis conditions include the electrical conductivity of the magnetic material at 5×10^6 [Sm^-1], and the magnetic field characteristics of the magnetic material were based on the relationship between magnetic flux density and magnetic field (B-H curve) shown in the diagram. For more details, please download the catalog.
Perform frequency response analysis Finite element method magnetic field analysis software (magnetic field simulator) ■□■Features■□■ ■Since it is integrated with the PHOTO series dedicated pre-post, data creation, analysis, and result processing can be performed as a series of operations. ■It is integrated with other PHOTO series modules, allowing for easy coupled analysis, such as obtaining temperature distribution from heat generation determined by electromagnetic field analysis. ■A revolutionary speedup has been achieved through the combined use of edge element method and ICCG method (dozens of times faster than conventional finite element methods). ■When a sine wave input is used and linear approximation holds, results can be obtained in a single calculation without the need for time-stepping calculations. ■Since it uses the finite element method, the solutions are stable, making it safe for beginners to use. ■Coupled calculations with thermal conduction analysis, stress analysis, and fluid analysis are easy.
This is a case study that confirms the current distribution observed when an alternating current flows through a conductor bundled with 19 strands of wire, using magnetic field analysis. Since frequency response magnetic field analysis is appropriate, the software "PHOTO-EDDYjω" was selected. The input voltage was adjusted to ensure that the maximum value of the resulting current density (absolute value) is 1. As a result, at a frequency of 1×10^5 [Hz], the current density was almost constant, while at a frequency of 1×10^7 [Hz], a concentration of current density was observed on the surface of the outermost layer of the conductor. 【Case Summary】 ■ Software Used: PHOTO-EDDYjω ■ Analysis Results - 1×10^5 [Hz]: Almost constant - 1×10^6 [Hz]: Gradual distribution of current density observed - 1×10^7 [Hz]: Concentration of current density observed on the surface of the outermost layer of the conductor *For more details, please refer to the related links or feel free to contact us.
The eddy current testing (non-destructive testing) using the external field method has a significant analytical symmetry, which is divided into a conductor plate and a probe. The probe consists of two types of coils: an excitation coil and a differential detection coil. We calculated the eddy current distribution when a current with a frequency of 500 Hz was applied to the excitation coil of the probe, as well as the induced electromotive force in the differential detection coil. For more details, please download the catalog.
If metal is installed near an RFID card, the electromotive force generated in the card's circuit by the external primary coil is significantly reduced due to the demagnetizing effect from the metal. To suppress this demagnetizing effect, we analyzed the changes in electromotive force when a magnetic sheet is attached to the surface of the card using Photo-Eddyjω. For more details, please download the catalog.
We will introduce the analysis results when using coils and external field coils with the finite element method (FEM) for the same analysis target. We adopted "Team Workshop Problem 7," which involves placing a coil on a perforated conductor. Since this problem has measurement values, we compared the results under three conditions: FEM, external field coil, and measurement values, and we also conducted analyses with the coil moved. In the results of the external field and FEM, the graphs overlapped, and the comparison with the measurement values was also favorable. 【Case Overview】 ■ Software Used: PHOTO-EDDYjω ■ Analysis Conditions ・Frequency: 200 [Hz] ・Current Value: 2742 [AT] ・Electrical Conductivity of Conductor: 3.526×10^7 [S/m] ■ Results of External Field and FEM: The graphs overlapped, and the comparison with measurement values was also favorable. *For more details, please refer to the related links or feel free to contact us.
We will introduce a case where current was passed through a cable, and the current value flowing in the secondary coil and the induced voltage were analyzed. The analysis model utilized symmetry, creating a 1/2 model, and a high permeability magnetic material was used for the core. The current sensor consists of a ring-shaped core and winding, with the measured current flowing through the cable at the center of the core, allowing us to obtain a small current flowing in the winding (secondary side). 【Case Overview】 ■ Software Used: PHOTO-EDDYjω ■ Analysis Conditions - Current value of the primary coil: 10[A] - Frequency: 50[Hz] - Number of turns in the secondary coil: 1000[turns] - Load resistance of the secondary coil: 100[Ω] *For more details, please refer to the related links or feel free to contact us.
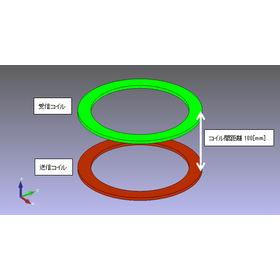
In recent years, research and development of wireless power transmission technology, which transmits power wirelessly, has been conducted. First, as a basic model, we consider two coils as shown in the left diagram. The transmitting coil and the receiving coil are arranged vertically, and circuit elements are connected to the coils. On our company website, we introduce analysis examples of wireless power transmission using electromagnetic induction. For more details, please refer to the related links below. 【Case Overview】 ■ Software Used: PHOTO-EDDYjω ■ Analysis Results ・Self Inductance: 358.7 [uH] ・Mutual Inductance: 38.4 [uH] *For more details, please check the related links or feel free to contact us.
Here is an example of magnetic field analysis for magnetic shielding. The analysis model uses the "Box shield model" proposed by the Electric Society's Investigation Committee. The analysis model is based on symmetry and is a 1/8 model, using an external field coil. Dynamic magnetic field analysis is applied, taking into account eddy currents. 【Case Overview】 ■ Analysis Model: Box shield model ■ Coil: External field coil ■ Analysis Type: Frequency response dynamic magnetic field analysis ■ Shielding: Linear material *For more details, please refer to the related links or feel free to contact us.
■ Magnetic field/magnetic field analysis software (magnetic field simulator) using a combination of finite element method and H-method, capable of performing static analysis and transient response analysis. ■ Can handle three-dimensional problems. ■□■ Features ■□■ ■ Can create analysis models without creating air regions. ■ Integrated with the PHOTO series dedicated pre/post-processing, allowing data creation, analysis, and result processing to be performed as a single operation. ■ Achieves revolutionary speedup through the combination of edge element method and ICCG method (dozens of times faster than conventional finite element methods). ■ Provides stable solutions using finite element method, making it safe for beginners to use.
This is a case study analyzing the current distribution of superconducting tape using transient magnetic field analysis with the H method. The "n-value model" is used for the E-J characteristics of the superconducting tape. By using the magnetic field analysis module "PHOTO-EDDYTM," it is possible to analyze with a mesh of only the conductor, eliminating the need for an air mesh. 【Case Overview】 ■ Software Used: PHOTO-EDDYTM ■ Analysis Conditions ・Current Value: 50[A] (maximum)… varies over time according to a function ・Material Conditions: Relative permeability 1.0, electrical conductivity as per program [S/m] ・The "n-value model" is used for the E-J characteristics of the superconducting tape. *For more details, please refer to the related links or feel free to contact us.
■ Magnetic field/magnetic field analysis software (magnetic field simulator) using a combination of the finite element method and H-method, capable of performing static analysis and frequency response analysis. ■ Can handle three-dimensional problems. ■□■ Features ■□■ ■ Can create analysis models without creating air regions. ■ Integrated with the PHOTO series dedicated pre- and post-processing, allowing data creation, analysis, and result processing to be performed as a single operation. ■ Achieves revolutionary speedup through the combination of edge element method and ICCG method (dozens of times faster than conventional finite element methods). ■ Provides stable solutions using the finite element method, making it safe for beginners to use.
This is an introduction to a case study analyzing the magnetic flux density distribution, self-inductance, and mutual inductance of a transformer composed of primary and secondary windings and a magnetic circuit (iron core) when excited. The software "PHOTO-EDDYTMjω" was used. A current of 1A at a frequency of 1000Hz was applied to the primary and secondary windings. Additionally, the number of nodes was 18,118, and the number of elements was 13,648, with the shape modeled in three dimensions as a full model. [Case Overview] ■ Software Used: PHOTO-EDDYTMjω ■ Analysis Conditions - Model using iron core and primary/secondary windings - Applied a node current of 1A at 1000Hz to the primary and secondary windings *For more details, please refer to the related links or feel free to contact us.
We will introduce the analysis results of eddy current distribution, self-inductance, and mutual inductance. The analysis was conducted for three cases: only conductor 1, only conductor 2, and both conductors 1 and 2 carrying current. The mesh scale consists of 3,200 elements and 4,800 nodes. Using the magnetic field analysis module "PHOTO-EDDYTMjω," it is possible to perform the analysis with a mesh of only the conductors, eliminating the need for air mesh. [Case Overview] ■ Software Used: PHOTO-EDDYTMjω ■ Analysis Conditions - Current Value: 1[A] - Material Properties: Relative Permeability 1.0, Electrical Conductivity 1.0×10^6[S/m] - Frequency: 1.0[kHz] *For more details, please refer to the related links or feel free to contact us.
We will introduce the analysis results of current distribution (real part and imaginary part) and self-inductance. The mesh scale consists of 11,200 elements and 15,088 nodes. Using the magnetic field analysis module "PHOTO-EDDYTMjω," it is possible to analyze with a mesh of only conductors, eliminating the need for an air mesh. 【Case Overview】 ■ Software Used: PHOTO-EDDYTMjω ■ Analysis Conditions ・ Current Value: 1[A] ・ Frequency: 1000[Hz] *For more details, please refer to the related links or feel free to contact us.
Magnetic field (magnetic field) analysis software (simulator) using finite element method for static analysis ■□■Features■□■ ■ Since it is integrated with the PHOTO series dedicated pre- and post-processing, data creation, analysis, and result processing can be performed as a series of operations. ■ It is integrated with other PHOTO series modules, allowing for easy coupled analysis, such as deriving temperature distribution from heat generation obtained through electromagnetic field analysis. ■ Revolutionary acceleration has been achieved through the combined use of edge element method and ICCG method. (Dozens of times faster than conventional finite element methods) ■ The use of finite element method ensures stable solutions, making it safe for beginners to use. ■ Coupled calculations with stress analysis and fluid analysis are easy to perform.
IoTデバイス開発・運用の課題を解決。各ポイント解説資料を進呈