Utilization Techniques for "Graph Builder" for Research, Development, and Design - From Creating Commonly Used Graphs to New Discoveries - (Online Seminar on 10/29)
 SAS Institute Japan JMP Japan Division
Aren't you just using the data obtained from experiments and prototypes to create figures for reports?
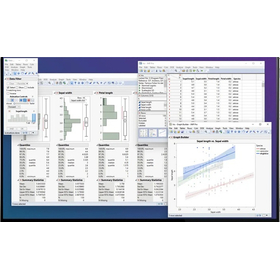
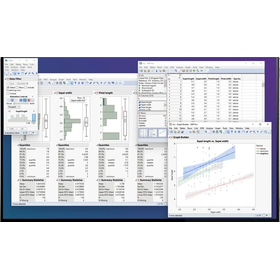
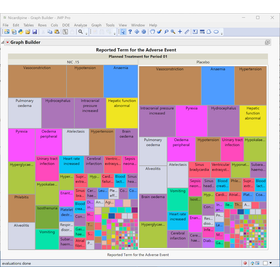
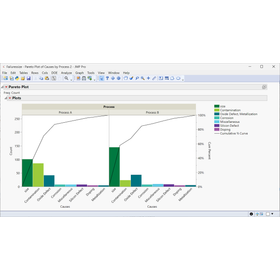
In this seminar, we will confirm the features and basic operations of JMP's Graph Builder, and using data typically obtained in research, development, and design departments as examples, we will create commonly used graphs such as mean values with error bars, box plots, and scatter plots with regression lines. Additionally, we will demonstrate an approach that leads to new discoveries by switching conditions, which is difficult to achieve with spreadsheets like Microsoft Excel.
Target Audience:
- Engineers who regularly handle experimental or prototype data
- Those who currently create graphs in Excel and feel challenged by the effort required for conditional comparisons and plotting
Main Content:
- Features and basic operations of Graph Builder
- How to create graphs commonly used in research, development, and design departments
- Utilizing features that promote new discoveries, which are difficult with spreadsheets
- Customizing graphs and producing high-quality outputs
Details & Registration:
https://www.jmp.com/ja/events/live-webinars/non-series/2026/10-29-graph-builder
| Date and time | Thursday, Oct 29, 2026 02:00 PM ~ 03:00 PM Online seminar using Zoom |
|---|---|
| Entry fee | Free Advance registration is required. |
Inquiry about this news
Contact Us OnlineMore Details & Registration
Details & Registration