

Visualizing energy usage to streamline management tasks! A rich lineup tailored to various loads.


Built-in power outage backup battery! Capable of responding to battery depletion of the uninterruptible power supply within the facility and power outages.


Compact IoT Sensor with Built-in Modbus RTU Communication for Circuit-Level AC Current Measurement (125–630A)


A device to eliminate faults caused by inrush current phenomena during the energization of power transformers.


The visual inspection of meter reading operations has become easier! The definitive version of a small to medium-sized automatic meter reading system! Easy to implement and operate!


Contributing to the mitigation of the deterioration of the global environment and the realization of clean production activities! Featuring an air compressor quantity control panel.


Over 22,000 delivery achievements! The only bus duct system specialist manufacturer in Japan is currently offering a "catalog digest edition"!

Reduce the burden on stores and offices! A management system that achieves company-wide efficient energy saving.


OK from smartphones and PCs! Real-time power monitoring device.


Protect against accidental electrical accidents! 24-hour remote monitoring service.

This is a distribution board that branches and supplies DC power at 48V.

Understand the "simple electric power" of the main and branch circuits of the distribution board by circuit. Simple power and energy sensor compatible with Modbus RTU.

Understand the "simple electric power" of the main and branch circuits of the distribution board by circuit. Simple power and energy sensor compatible with Modbus RTU.


Regardless of whether the breaker itself is self-resetting or what type of auxiliary contact it is, it will accurately display according to the selected type.


To customers using cubicles: We recommend updating approximately every 20 years from installation.
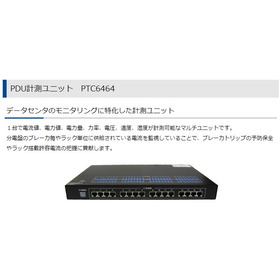

A multi-measurement device that can measure the maximum, average, and minimum values of current, power, and temperature at 64 points each, with a minimum interval of one minute, for distribution boards and breaker units.


We will monitor, control, and operate electrical equipment in various (power) plants.


There is a difference in height between the front and back projections!


A state-of-the-art building energy management system implemented in over 75 countries and regions worldwide. Compatible with standard network protocols.


Compliant with the international standard IEC61850. Providing Japanese SCADA (Supervisory Control and Data Acquisition) compatible with multi-vendor IEDs!


A low-cost demand controller that can quickly pay for itself even in small and medium-sized businesses.

Patent obtained in December 2018! Significantly reducing demand and electricity consumption while protecting the environment!


We offer custom fabrication of raised platforms for various panel equipment, including control rooms. Please consult with us for all your needs regarding equipment elevation, as well as scaffolding and steps for operators.


"Visualizing the condition of equipment." Achieving early detection of abnormalities and stable operation.


Centralized management of power consumption in offices and labs.


Technical suitability certification obtained! Provides functionality to view various sensor data.

A web platform that can cloud-enable energy and equipment data.


Over 1,200 implementations in just a few years! A trading platform that allows companies using electricity to proactively procure power! A free booklet explaining the overview and more is available!


We will achieve improved performance in the management of your energy facilities.


Remote monitoring of factory equipment operating status and digitization of inspection work to improve operational efficiency. Achieving advanced utilization of data in work performance and trend management.


Providing quick and reliable support! Easily build monitoring systems for various applications.


This is a standard product for a voice reporting device that uses a regular line (telephone line).


It is ideal for legacy interfaces.

Contributing to the environmental measurement and monitoring of corporate IT systems! Network-compatible integrated power meter.


The starting point is the visualization of electricity! It displays power consumption in an easy-to-understand manner, in terms of cost and CO2 equivalent.


By managing and controlling demand, it is possible to reduce the demand power and lower the basic fees of the demand contract.

The "IOG-100" is a gateway equipped with the MQTT protocol, enabling data integration with IoT platforms.

A system for visualizing electricity usage based on the revised Energy Conservation Law and contributing to CO2 reduction for preventing global warming through solar power generation and renewable energy measurement.


The MV POWER STATION is a product that is compactly installed and wired with PCS, transformers, RMU, and control power inside a container.

Correcting fluctuations in solar power generation! Bidirectional power conditioner compatible with large-scale storage systems.

This is an AC distribution board for data centers that adopts a unique internal structure to solve issues related to miswiring and a shortage of skilled workers.

This is a manager software compatible with the Modbus protocol that achieves energy saving and improvements in productivity and quality.

We contribute to the development of an information and communication society with solutions that support the safety and efficiency of power supply.

We will introduce the features of our measurement and monitoring system to address concerns such as 'I want to visualize the energy consumption of telecommunications equipment.'

We will introduce the features of our measurement and monitoring system for concerns such as 'I want to visualize the energy consumption of the data center.'

We will introduce the features of our measurement and monitoring system to address concerns such as 'I want to visualize the energy usage of our factory.'

We will introduce an example of a system configuration using the "PAL series sensors × PLC," which is optimal for taking the first step towards visualizing electricity by utilizing already installed equipment.

An example of a system configuration using the "PAL Series Sensor × PUSHLOG" that enables immediate visualization of power without the need for server or network setup.

A shop specializing in IoT will help you realize visualization!

Introducing a system configuration example using the "PAL Series Sensor × CEW-M4," ideal for large-scale centralized management visualization!

The split clamp-type sensor enables easy and quick visualization of energy usage, contributing to energy savings in data centers through constant monitoring of the distribution board.

You can safely and easily install sensors using the "retrofit clamp-type sensor" without stopping the equipment currently in operation.

We would like to introduce the "Map Display" feature of the CEW-M4, which allows you to graphically display measurement values on any diagram, such as floor plans and photos.

We will introduce the environment in which our products are made, showcasing the Hexacore headquarters and factory.

Smart Power Visualization for Every Equipment with Modbus-Compatible IoT Sensor to Accelerate Energy Savings

By packaging the required equipment, you can start data visualization without time-consuming on-site surveys or complicated design processes.

Do you think achieving equipment visualization requires complex on-site surveys and design processes? With our solution, simply installing the device makes equipment visualization possible.

IoT sensor with built-in communication capabilities for visualizing power consumption per equipment, featuring simplified cumulative energy measurement and Modbus communication support (rated 125A to 630A)

It looks like a clamp CT… but it’s actually different! Three Key Features of PAL Series Sensors

It looks like a clamp CT… but it’s actually different! Three Key Features of PAL Series Sensors

The same series also includes the PAL-Plus Type E, offering a more cost-effective solution for simplified cumulative energy measurement. Learn more here.

Visualize the power of the equipment and detect anomalies. Easily implementable in existing equipment with Modbus compatibility.

IoT sensor with built-in communication function capable of measuring simple accumulated electric power compatible with Modbus communication, visualizing power for each device (125A to 630A).

Collect simple power and simple energy using Modbus RTU (RS-485) and visualize the main and branch circuits of the distribution board.

The first step in energy-saving considerations. Collecting "circuit-specific" simple power and simple energy amounts from the main and branch circuit breakers of the distribution board via Modbus RTU.

Retrofit to the distribution board to visualize by circuit. No need for power outage work with split clamps, simple power and simple energy sensors compatible with Modbus RTU.

At the entrance to visualizing and IoT-enabling factories. Collect circuit-specific data from the distribution board retroactively without the need for power outage work, and link it to higher systems via Modbus RTU.

No need for a power outage; it can be easily retrofitted. You can visualize the simple accumulated electric power at a low cost.

The first step in energy conservation: sensors that can be used for circuit-specific visualization.

Visualize equipment easily and quickly without on-site surveys or design.

Start visualizing equipment just by connecting the sensor and gateway.

You can start visualizing energy "quickly" and "easily."

Early detection of signs using gateways and sensors.


You can centrally monitor up to 128 points of electric motor current! Introducing devices scattered throughout the plant.


A protective relay that detects internal faults in transformers and prevents serious accidents!


Alarm forwarding, automatic control of air conditioning and lighting! Low cost, high performance.


From power monitoring and fluid monitoring to valve opening and closing control, everything is integrated into a comprehensive system for scheduled operation of equipment. It is an effective "monitoring and control system" for on-site operations.


Touei New Energy Development Co., Ltd. aims for energy development that coexists with nature.

To prevent accidents before they occur, the level of leakage current is categorized and indicated by a light display.

It is a device that monitors high DC voltage and prevents damage.


The only one in the world. "Complete solid insulation" that does not use oil or SF6 gas.