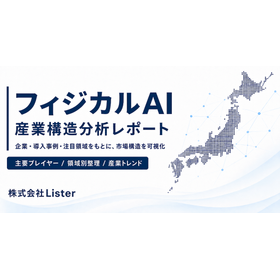
Comparison of 669 Japanese companies, 142 American companies, and 180 Chinese companies related to physical AI. Analyzing entry opportunities from the perspectives of technology domains, industrial structures, and social implementation.
This is an analytical report comparing the differences in corporate composition, technological domains, social implementation, and inter-company collaboration in the physical AI industries of Japan, the United States, and China. Based on a proprietary corporate database developed by Lister Inc., it compares 669 companies in Japan, 142 in the United States, and 180 in China across common technology categories. The corporate composition in areas such as robotics and field automation, AI and software, components and mechanisms, autonomous driving and drones, and recognition and sensing is visualized. Furthermore, it organizes the role composition of 896 supply companies in Japan, the business domains of 142 companies in the United States, and the product domains of 180 companies in China. It examines social implementation in manufacturing, logistics, and construction, as well as the division of roles in technology supply, system integration, sales, and operational support, considering entry and collaboration opportunities where Japanese companies can leverage their strengths. A PDF report and a detailed version of the source corporate database are provided for free.
Inquire About This Product
basic information
**Main Analysis Content** - Comparison of technology domains in Japan, the United States, and China - Comparison of industrial and collaborative robots, humanoids, AMRs, etc. - Comparison of robot AI, foundational models, and development platforms - Role composition of 896 supply companies in Japan - Business domain composition of 142 companies in the United States - Product domain composition of 180 companies in China - Social implementation in manufacturing, logistics, and construction - Inter-company collaboration and entry opportunities for Japanese companies **Common Category Comparison** Japan: 669 companies / United States: 142 companies / China: 180 companies **Provided Content** PDF analysis report + detailed company database *Note: There are differences in the classification methods and coverage of each country's database, and this is not a comparison indicating market size or technological superiority.*
Price information
Free provision of PDF reports and detailed corporate databases.
Delivery Time
※After confirming the registration information, it will be sent sequentially via email.
Applications/Examples of results
**Main Utilization Purposes** - Comparison of the physical AI industries in Japan, the United States, and China - Market research on overseas robotics and AI companies - Examination of overseas expansion and entry areas for our own technology - Exploration of collaboration and technology partnership candidates with overseas companies - Consideration of opportunities for domestic introduction and sales support of overseas products - Comparison of competing companies and technology areas - Initial research on investment and M&A candidates - Market analysis for new business and management planning This can be utilized by manufacturing companies, trading firms, financial institutions, consulting firms, robotics and FA-related companies, and new business and management planning departments to understand the differences in corporate composition and social implementation between Japan, the United States, and China.
catalog(1)
Download All Catalogs
Company information

Lister Inc. collects, organizes, and analyzes information on companies, factories, technologies, and markets in the manufacturing sector. We help businesses make better-informed decisions in areas such as sales, market research, new business development, and product planning.