By simply entering an address, visualize the trade area of all stores in both map and 3D. From evaluating potential store locations to designing advertising areas, all on a single map.
"Mitahashi" is a market visualization and analysis tool aimed at owners and business managers of multi-store retail businesses. We have applied our 3D and 4D scanning and digital twin technology to decision-making for store location strategies. By simply entering an address, you can visualize the market area for each store on a map in 3D and automatically calculate the overlap of market areas between stores. Potential store locations are rated from S to C, and the investment recovery period can be estimated. The design of advertising distribution areas can be completed on a single map. It incorporates public statistics such as the 500m mesh population from the census, passenger numbers at train stations, and income data from municipalities, allowing you to view the population overlaid on the 3D urban model from the Ministry of Land, Infrastructure, Transport and Tourism's "Project PLATEAU," providing a three-dimensional view of daytime and nighttime market areas. Customer lists (CSV) are processed only within the browser, with no transmission to external sources. No installation is required; you can use it simply by opening a dedicated URL. A free demo that does not require registration is also available.

Inquire About This Product
basic information
【Advertising Area】 - Draw trade area circles for all stores based on the address and automatically calculate the overlap rate. - Load customer CSV (reach rate, store-specific coverage, density heat map). - Display a map of station passenger numbers and manage competing stores. 【Store Opening】 - Evaluate candidate locations from S to C, estimate recovery periods, and consider overlaps with existing stores. - A4 comparison report (print and PDF save). - 3D display (population height display, daytime and nighttime foot traffic, PLATEAU building model). - Estimate the number of potential store openings in the area and extract blank locations (CSV export). 【Built-in Data (all estimated values)】 - 2020 Census 500m mesh population, national numerical information on station passenger numbers, statistical overview of municipalities (income), location reference information, Project PLATEAU. 【Operating Environment】 Browser only (no installation required). Customer data is processed within the device.
Price information
Annual plan: Initial cost of 100,000 yen + monthly fee of 50,000 yen × 10 times (free for months 11-12), total of 500,000 yen (tax included) per year. Monthly plan: Initial cost of 300,000 yen + monthly fee of 50,000 yen (tax included). Both plans have no limit on the number of stores. Please feel free to inquire for a custom estimate.
Delivery Time
※You can start using it immediately just by opening the dedicated URL issued after your application.
Applications/Examples of results
【Target】 - Business owners and managers of multi-store retail businesses - Franchise headquarters - Individuals responsible for advertising settings and store openings 【Uses】 - Evaluation of potential store locations and estimation of investment recovery periods - Understanding wasted advertising costs due to overlapping market areas between stores - Design of advertising distribution areas (pin + radius) - Understanding customer distribution 【Related】 Daily management figures after store openings can be centrally managed with the marketing BI tool "Zenkei." The results of the advertising areas designed with Mihirashi can be checked in Zenkei's advertising reports. ▶ Free demo (no registration required): https://zenkei.app/miharashi/
Detailed information
-
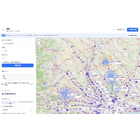
Map the trade areas of all stores on a single map. Simply enter the address, and it will draw the trade area for each store on the map and automatically calculate the overlap rate.
-
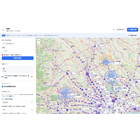
Customer distribution in a heatmap. The customer list (CSV) is processed only within the browser and is not sent externally.
-
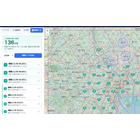
"Searching for vacant locations where stores can be opened" We estimate the number of possible store openings in the area and create a list of vacant locations with a high population.
-
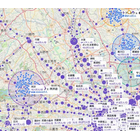
The number of passengers at the station can also be displayed on the map, allowing for decisions on store openings and advertising based on the flow of people, using public statistics on station passenger numbers.
catalog(1)
Download All Catalogs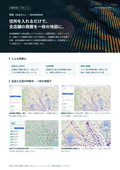
Company information

IZUTSUYA Inc. digitizes real-world spaces and objects by combining 3D/4D scanning, centered on 3D Gaussian Splatting (3DGS), with AI. We adopted 3DGS in our work early, in 2024, and have recorded buildings, traditional crafts, plants, and even human gestures and dance movements as high-fidelity 3D/4D data. We provide an end-to-end service: capture, data optimization and mesh conversion, and publishing, sales and license management on our own 3D data platform, 3Dasset.io. From digital archiving of cultural heritage and infrastructure inspection DX using LiDAR point clouds and AI, to Location XR experiences that combine places with human movement, we help bring 3D technology into culture, construction, tourism and entertainment. We choose between DSLR cameras, 360-degree cameras, LiDAR and markerless motion capture according to each project, and work with research institutions to field-test new equipment and methods. Please feel free to contact us.
![On-site Improvement Work Analysis Standard Tool "Time Prism" [Materials Provided]](https://image.mono.ipros.com/public/product/image/4cc/2001533878/IPROS11471229766871384453.png?w=280&h=280)

![[CRM Success Case] Japan Food Research Holdings Co., Ltd.](https://image.mono.ipros.com/public/product/image/2078084/IPROS8897995854058592868.png?w=280&h=280)