We have compiled a list of manufacturers, distributors, product information, reference prices, and rankings for Analysis Software.
ipros is IPROS GMS IPROS One of the largest technical database sites in Japan that collects information on.

Analysis Software Product List and Ranking from 288 Manufacturers, Suppliers and Companies | IPROS GMS

Last Updated: Aggregation Period:Jul 22, 2026~Aug 18, 2026
This ranking is based on the number of page views on our site.

Analysis Software Manufacturer, Suppliers and Company Rankings

Last Updated: Aggregation Period:Jul 22, 2026~Aug 18, 2026
This ranking is based on the number of page views on our site.

  1. ウェーブフロント 本社 Kanagawa//software
  2. null/null
  3. ミューテック Tokyo//software
  4. 4 BLUE TAG Tokyo//software
  5. 5 日本イーエスアイ Tokyo//software

Analysis Software Product ranking

Last Updated: Aggregation Period:Jul 22, 2026~Aug 18, 2026
This ranking is based on the number of page views on our site.

  1. Lighting and optical analysis software "Lighting Simulator CAD" Camerium
  2. Fatigue Life Prediction Analysis Software 'FEMFAT' マグナ・インターナショナル・ジャパン マグナパワートレイン・ECS(Engieering Center Steyr)
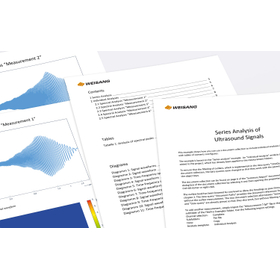
  3. Thermal image analysis software "EI-STUDIO" for FLIR thermal cameras. イー・アイ・ソル
  4. 4 Welding analysis software SYSWELD/VisualAssembly 日本イーエスアイ
  5. 5 Network Camera Recording Playback and Image Analysis Software KxViewPro4 ネットカムシステムズ

Analysis Software Product List

1201~1230 item / All 1296 items

Displayed results

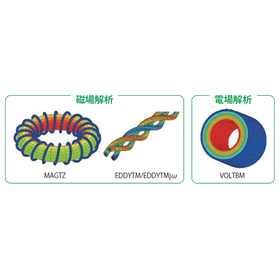
Electric Field Analysis Software 【μ-EXCEL Basics of Electromagnetic Field Analysis / Materials】

Electromagnetic phenomena, Maxwell's equations, and examples of analysis using the finite element method! Explained with illustrations and diagrams.

This document introduces the world of electromagnetic simulation, covering electromagnetic phenomena, Maxwell's equations, and examples of analysis using the finite element method. It is an excerpt from the analysis know-how video site "Analysis Know-How.com" by μ-EXCEL. The explanations are made easy to understand using illustrations and graphs. We encourage you to take a look. 【Contents】 ■ Electromagnetic phenomena ■ Maxwell's equations ■ Vector operations ■ Numerical calculations ■ Finite element method ■ Motor analysis ■ Other analyses 【We have launched Analysis Know-How.com (https://mu-excel.com)!】 - In the "Home" menu, you can find a list of know-how collections. - By clicking the "View Details" button, you can access know-how points and videos. - In the "Category" menu, you can filter by genre and series. - Use "Search by Keyword" to further narrow down related videos. - In the "Blog," we will introduce updated videos as they are released. ★ You can download sample software from the link below. * For more details, please refer to the PDF document or feel free to contact us.

  • Other environmental equipment
  • Analysis Software

Added to bookmarks

Bookmarks list

Bookmark has been removed

Bookmarks list

You can't add any more bookmarks

By registering as a member, you can increase the number of bookmarks you can save and organize them with labels.

Free membership registration

Electric Field Analysis Software 【μ-EXCEL Mutech Rakuten Market Store】

Familiar usability based on Excel. Full-scale thermal, structural, and electromagnetic field analysis available for subscription at a low price. *Benefits included.

"μ-Excel" is an affordable software for thermal, structural, and electromagnetic field analysis. It operates on Excel, allowing for professional simulations with a familiar interface. The software is structured in a series based on analysis themes, each equipped with dedicated macros for easy use. You can purchase the subscription version of this product at the newly opened Mutech Rakuten Ichiba store. 【Features】 ■ Input and output data are stored in sheets, allowing for flexible data processing. ■ Implements necessary tools such as modelers and meshers for finite element analysis. ■ Easy condition setting, with results obtainable in just a few minutes. ■ Adopts 2D or axisymmetric finite element methods. ■ Equipped with DXF import functionality and a material database feature. *For more details, please download the PDF or feel free to contact us. ★ We are celebrating the grand opening of the Mutech Rakuten Ichiba store! ★ ・Eligible product: μ-Excel Subscription New 3-Month License ・Benefit: 2000 yen OFF coupon ・Period: February 8, 2022 (Tuesday) 10:00 to March 1, 2022 (Tuesday) 9:59

  • simulator
  • Analysis Software

Added to bookmarks

Bookmarks list

Bookmark has been removed

Bookmarks list

You can't add any more bookmarks

By registering as a member, you can increase the number of bookmarks you can save and organize them with labels.

Free membership registration

Electric Field Analysis Software 【μ-EXCEL Analysis Know-How Video Site】

The video contains compact content of about 1 to 2 minutes! You can easily check the topics you want to know using your smartphone or other devices.

"Analysis Know-How.com" is a website that collects videos introducing the benefits of the analysis software μ-EXCEL, provided by Mutech, which is easy, fast, and suitable for initial assessments, along with analysis know-how. The videos are compact, lasting about 1 to 2 minutes, and allow for filtered searches by keywords and categories. You can easily check the items you want to know using your smartphone during your spare time. In the "Home" menu, you can find a list of know-how collections. By clicking the "View Details" button, you can access the key points and videos of the know-how. In the "Category" menu, you can narrow down by genre or series. With "Keyword Search," you can further refine related videos. In the "Blog," we will introduce updated and additional videos as they become available. μ-EXCEL is available as a subscription service for 9,800 yen per month (excluding tax). Additionally: - We offer professional consulting that delves into your issues. - We also provide contract analysis and custom development at a low cost. Please feel free to contact us for more details.

  • Other analyses
  • Analysis Software

Added to bookmarks

Bookmarks list

Bookmark has been removed

Bookmarks list

You can't add any more bookmarks

By registering as a member, you can increase the number of bookmarks you can save and organize them with labels.

Free membership registration

加熱解析ソフト 【μ-TM 誘導加熱の磁場・温度解析ソフト】

3次元誘導加熱解析ソフト、コイルの移動なども簡単に設定できます

解析に不慣れな設計・研究の方にも、手軽に操作できるソフトに仕上げています。簡単なコイル設定で、加熱コイルの移動もインターフェースで簡単に設定できます 詳細は【解析ノウハウ.com】の「063 μ-TMの紹介」をご覧ください ポイントはこちら ・誘導加熱・温度解析の専用ソフト ・加熱コイルの有限要素分割は不要 ・複雑なコイル形状やコイルの移動が簡単 ・ウィザード形式で解り易い条件設定 ・3次元誘導加熱解析をもっと身近に さらに ・お客様の問題に踏み込んだ、プロのコンサルティングをご提供 ・受託解析や、カスタム開発も、安価にご提供いたします

  • simulator
  • Analysis Software

Added to bookmarks

Bookmarks list

Bookmark has been removed

Bookmarks list

You can't add any more bookmarks

By registering as a member, you can increase the number of bookmarks you can save and organize them with labels.

Free membership registration

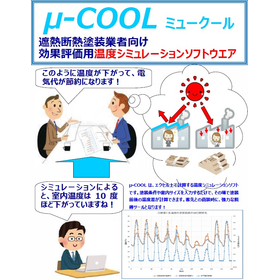
Heat conduction analysis software 【μ-COOL thermal insulation coating temperature analysis software】

With just simple information input, the temperature effects before and after painting can be measured on the spot!

μ-COOL is a temperature simulation software that calculates temperature effects on Excel. By simply inputting painting conditions and room sizes, you can calculate the temperature effects before and after painting on the spot. It serves as a powerful persuasive tool during negotiations with clients. ■Features - Uses Excel macros - Utilizes NEDO's solar radiation database - Allows setting the size of facilities (factories), etc. - Calculates indoor temperature changes over 10 days - Calculates temperature reduction effects with and without heat-reflective paint - Customizable *For more details* If you have any questions or concerns, please feel free to contact us!

  • Thermometer
  • Analysis Software

Added to bookmarks

Bookmarks list

Bookmark has been removed

Bookmarks list

You can't add any more bookmarks

By registering as a member, you can increase the number of bookmarks you can save and organize them with labels.

Free membership registration

Heat conduction analysis software 【μ-EXCEL Heat Conduction Edition】

The flow rate of the cooling water is approximated by the heat transfer coefficient! Evaluated with animations and temperature history at evaluation points!

In the heat conduction version, you can define heating elements and cooling pipes. It is a simple analysis, but it allows for easy transient temperature analysis. For details, please refer to "NO.101 Introduction to the Heat Conduction Version: Finding Temperature Distribution and Changes" on 【Analysis Know-How.com】. Here are the key points: - It allows for transient temperature analysis. - The flow rate of the cooling water is approximated using the heat transfer coefficient. - You can set the heating and non-heating of the heating elements. - Calculations are performed for time steps. - Evaluation is done through animations and temperature history at evaluation points.

  • Other analyses
  • Analysis Software

Added to bookmarks

Bookmarks list

Bookmark has been removed

Bookmarks list

You can't add any more bookmarks

By registering as a member, you can increase the number of bookmarks you can save and organize them with labels.

Free membership registration

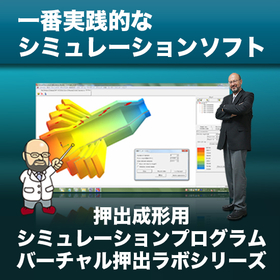
Medical Virtual Extrusion Lab Series

Pre- and post-integrated analysis software that achieves optimal design and stable molding.

In the medical industry, precision molding is of utmost importance for product quality and safety. Particularly in the manufacturing of medical devices and instruments, accuracy of dimensions, uniformity of materials, and stability after molding are required. Molding defects can lead to product malfunction and pose risks to patients. The "Virtual Extrusion Lab Series" supports the resolution of extrusion molding challenges with easy operation. 【Usage Scenarios】 - Precision molding of medical tubes, catheters, syringes, etc. - Design and manufacturing of irregular extrusion products - Optimization of material selection and molding conditions 【Benefits of Implementation】 - Cost reduction through the reduction of molding defects - Early detection of issues during the design phase - Shortening of product development time - Stable supply of high-quality medical devices

  • Extrusion Machine
  • Analysis Software

Added to bookmarks

Bookmarks list

Bookmark has been removed

Bookmarks list

You can't add any more bookmarks

By registering as a member, you can increase the number of bookmarks you can save and organize them with labels.

Free membership registration

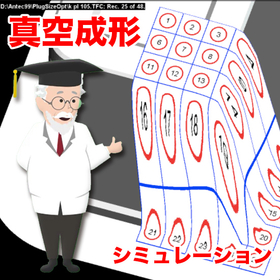
T-SIM for Container Manufacturers

Accurate analysis of drawdown and cooling. Reproduction of various vacuum forming processes.

In the container industry, molding technologies that can accommodate a variety of shapes and materials are in demand. Particularly for containers with high design quality or those that pursue functionality, it is crucial to accurately predict the behavior of the sheet during molding and to mold under optimal conditions. Improper molding can lead to a decline in container quality and a deterioration in yield. T-SIM adopts an integral viscoelastic model to accurately analyze sheet sag during drawdown and cooling after molding, enabling flexible reproduction of various vacuum forming processes. 【Application Scenarios】 - Food containers - Medical containers - Industrial containers 【Benefits of Implementation】 - Optimization of wall thickness distribution - Suppression of molding defects - Reduction of material costs

  • Other molds
  • Analysis Software

Added to bookmarks

Bookmarks list

Bookmark has been removed

Bookmarks list

You can't add any more bookmarks

By registering as a member, you can increase the number of bookmarks you can save and organize them with labels.

Free membership registration

SpectraView V2-NI/cDAQ

Capture vibration waveforms at high speed! Used by many customers.

"SpectraView V2-NI/cDAQ" is software that connects the data logger "cDAQ series" manufactured by National Instruments Japan to a computer, allowing for real-time FFT analysis while collecting high-speed vibration waveform data and more. It is the NI product version of the "Spectra View" series, which is loved by many customers. Its compact design makes it useful for equipment maintenance tasks and on-site testing, enabling the recording and analysis of various data. 【Features】 ■ Easy high-speed data recording and analysis ■ Capable of capturing vibration waveforms at high speed ■ Simple data measurement ■ Significant efficiency improvements in work ■ Suitable for collecting test data across a wide range of fields *For more details, please refer to the PDF materials or feel free to contact us.

  • Other information systems
  • Analysis Software

Added to bookmarks

Bookmarks list

Bookmark has been removed

Bookmarks list

You can't add any more bookmarks

By registering as a member, you can increase the number of bookmarks you can save and organize them with labels.

Free membership registration

General-purpose data recording and analysis software GMAS128

A measurement system that implements your requests as features! Capable of handling a wide range of tasks.

Until now, have you ever felt dissatisfied with the functionality and performance of the software that comes with your data recording equipment? This system is a measurement and analysis software that can output analysis results for a wide range of applications while keeping costs down. *It is also possible to output the report format in a layout according to the user's request. 【Features】 ◆ Real-time display of measurement data (display of selected channels). ◆ Display and file output of saved measurement results (Taffmat format, CSV format, etc.). ◆ Ability to set measurement conditions and register templates (unlimited maximum measurement conditions per test, subject to storage capacity). ◆ Waveform display of measurement data. ◆ Ability to exclude data values considered to be noise from the measurement data. ♦ Additional analysis functions can be added as needed. *We also offer guidance using a demo unit. For details, please contact us via 'Request for Materials' or 'Download'.

  • Other information systems
  • Analysis Software

Added to bookmarks

Bookmarks list

Bookmark has been removed

Bookmarks list

You can't add any more bookmarks

By registering as a member, you can increase the number of bookmarks you can save and organize them with labels.

Free membership registration

Control System Design Analysis Tools and Their Applications

★Learn control system design software from the basics! ★A software that can be easily used by those who are not very familiar with differential equations and complex number operations!

Lecturer Professor Ryoji Katayanagi, Department of Aerospace System Engineering, Kanazawa Institute of Technology Target Audience: Engineers, researchers, and relevant departments interested in control engineering Venue: Kawasaki City Educational and Cultural Center, Room 3 [Kanagawa, Kawasaki] 15 minutes on foot from JR and Keikyu "Kawasaki Station" Date and Time: May 20, 2011 (Thursday) 10:30 AM - 4:30 PM Capacity: 20 people *Registration will close once full. Please apply early. Participation Fee: 18,900 yen (including tax and textbook costs) for up to 2 people per company.

  • Company:AndTech
  • Price:10,000 yen-100,000 yen
  • Technical Seminar
  • Analysis Software

Added to bookmarks

Bookmarks list

Bookmark has been removed

Bookmarks list

You can't add any more bookmarks

By registering as a member, you can increase the number of bookmarks you can save and organize them with labels.

Free membership registration

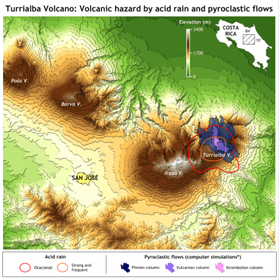
"Surfer" for visualization of mineral deposits and planning of mining operations for the mining industry.

2D and 3D topographic mapping software to support resource quantity evaluation in mining.

In the field of mining, accurately understanding resource quantities is essential. To conduct precise resource evaluations, it is necessary to accurately visualize and analyze terrain data from both the surface and underground. Inaccurate terrain data or inappropriate analyses can lead to underestimation or overestimation of resource quantities, significantly impacting mining plans and investment decisions. Surfer supports resource evaluations by creating accurate 2D and 3D maps and models from various data sources, including LiDAR data. 【Use Cases】 - Visualization of mineral deposits - Planning of mining operations - Estimation of resource quantities 【Benefits of Implementation】 - Realization of accurate resource evaluations - Improvement of mining efficiency - Enhanced accuracy of investment decisions

  • surfer_TurrialbaVolcano-400x402-1.png
  • logo_jp_surfer_350.png
  • Earth Sciences
  • Distance measuring device
  • Other measurement, recording and measuring instruments
  • Analysis Software

Added to bookmarks

Bookmarks list

Bookmark has been removed

Bookmarks list

You can't add any more bookmarks

By registering as a member, you can increase the number of bookmarks you can save and organize them with labels.

Free membership registration

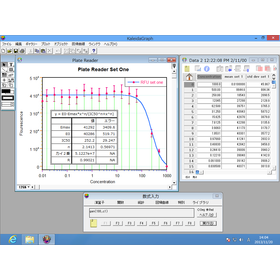
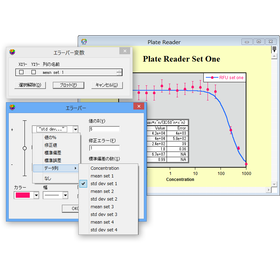
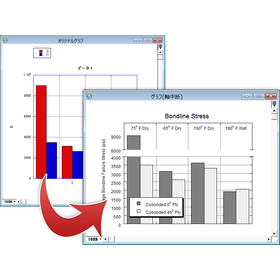
KaleidaGraph: Experimental Data Visualization for Physics Researchers

Standard tools for graph creation and data analysis.

In the field of physics research, it is essential to accurately analyze experimental data and simulation results and to express them visually in an easily understandable manner. Particularly when dealing with complex equations and multidimensional data, data visualization and detailed analysis significantly influence the quality of research. KaleidaGraph is equipped with scientifically accurate graphing capabilities and advanced data analysis functions, supporting researchers in efficiently conducting data analysis and clearly communicating their research findings. 【Usage Scenarios】 - Visualization and analysis of experimental data - Graphing of simulation results - Interpretation of data through statistical analysis - Creation of graphs for papers and presentation materials 【Benefits of Implementation】 - Increased efficiency of analysis through data visualization - Deeper insights from advanced analysis functions - Enhanced visual representation of research findings - Strengthened persuasiveness in papers and presentations

  • Kaleida_01.png
  • Kaleida_02.png
  • Kaleida_03.png
  • kaleida_1110_350.png
  • Statistical analysis
  • Visualization
  • Other analyses
  • Analysis Software

Added to bookmarks

Bookmarks list

Bookmark has been removed

Bookmarks list

You can't add any more bookmarks

By registering as a member, you can increase the number of bookmarks you can save and organize them with labels.

Free membership registration

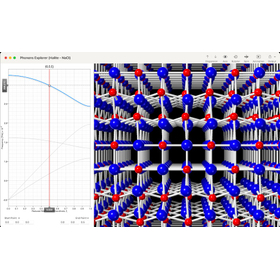
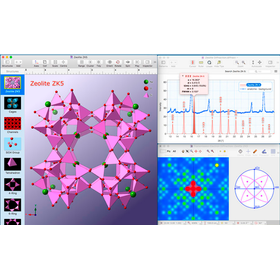
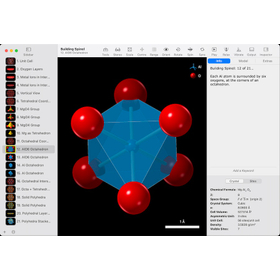
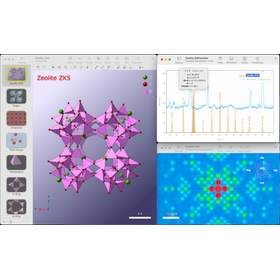
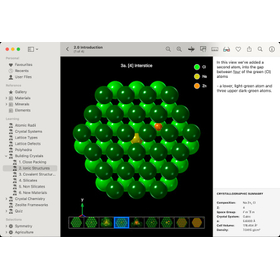
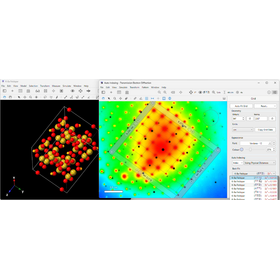
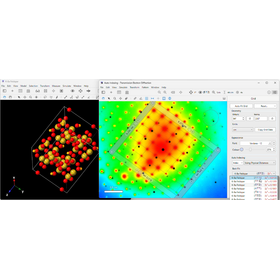
Molecular Structure Analysis and Modeling for Drug Discovery: 'CrystalMaker'

A visualization tool for crystal structures and molecular structures that accelerates drug discovery research.

In the drug discovery industry, understanding the structure and function of compounds is essential for new drug development. In particular, accurate visualization of molecular structures aids in predicting drug efficacy and identifying drug discovery targets. CrystalMaker supports structural analysis in drug discovery research through molecular structure modeling and crystal structure construction. 【Use Cases】 - Structural analysis of drug discovery targets - Molecular structure modeling of compounds - Drug efficacy prediction through crystal structure visualization 【Benefits of Implementation】 - Increased efficiency in drug discovery research - Shortened new drug development timelines - Improved research outcomes

  • CrystalMaker_0.png
  • building-spinel.jpg
  • cm-office.jpg
  • crystalviewer-viewer.jpg
  • IPROS6962750492815757754.png
  • crystal
  • X-ray Diffraction Equipment
  • Other physical property measurements and component analysis
  • Analysis Software

Added to bookmarks

Bookmarks list

Bookmark has been removed

Bookmarks list

You can't add any more bookmarks

By registering as a member, you can increase the number of bookmarks you can save and organize them with labels.

Free membership registration

Dynamic diffraction pattern "SingleCrystal" for battery research.

Accelerating structural analysis of battery materials in collaboration with CrystalMaker.

In the field of battery research, it is important to understand the structure of materials in detail to aim for the development of new materials and the enhancement of existing materials' performance. In particular, to elucidate the structural changes accompanying the charging and discharging of batteries, as well as the relationship between the crystal structure of electrode materials and their performance, diffraction pattern analysis is essential. SingleCrystal strongly supports the structural analysis of battery materials through the simulation of diffraction patterns from single crystals. In collaboration with CrystalMaker, it dynamically generates diffraction patterns based on structural data of materials, making it easier to compare with experimental results. 【Use Cases】 - Crystal structure analysis of battery materials - Tracking structural changes during charging and discharging - Diffraction pattern analysis of electrode materials 【Benefits of Implementation】 - Deepening understanding of material structures and improving research efficiency - Accelerating the development of new materials - Contributing to the improvement of battery performance

  • SingleCrystal_jp_1110_350.png
  • crystal
  • X-ray Diffraction Equipment
  • Other physical property measurements and component analysis
  • Analysis Software

Added to bookmarks

Bookmarks list

Bookmark has been removed

Bookmarks list

You can't add any more bookmarks

By registering as a member, you can increase the number of bookmarks you can save and organize them with labels.

Free membership registration

Structural Analysis of Pollutants for Environmental Analysis 'SingleCrystal'

Visualizing the structure of contaminants with CrystalMaker and SingleCrystal.

In the field of environmental science, understanding the structure of substances is essential for the identification and analysis of pollutants. In particular, advanced analytical techniques are required to identify trace pollutants and predict the behavior of substances in the environment. SingleCrystal supports the structural analysis of pollutants through diffraction pattern simulations from single crystals. By collaborating with CrystalMaker, it generates dynamic diffraction patterns based on the structural data of pollutants, thereby streamlining the analysis. 【Use Cases】 - Structural analysis of pollutants - Identification of substances in the environment - Simulation of diffraction patterns 【Benefits of Implementation】 - Deepens understanding of pollutant structures - Reduces analysis time - Enhances research efficiency

  • SingleCrystal_jp_1110_350.png
  • crystal
  • X-ray Diffraction Equipment
  • Other physical property measurements and component analysis
  • Analysis Software

Added to bookmarks

Bookmarks list

Bookmark has been removed

Bookmarks list

You can't add any more bookmarks

By registering as a member, you can increase the number of bookmarks you can save and organize them with labels.

Free membership registration

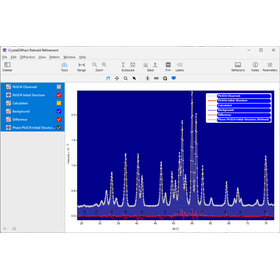
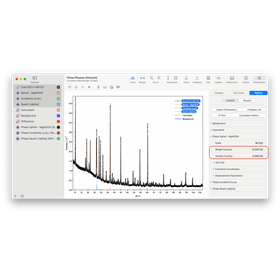
Structural analysis for battery material research using 'CrystalDiffract'

Analyzing the structure of battery materials using the Rietveld method "CrystalDiffract"

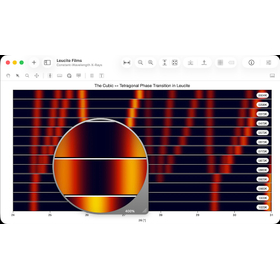
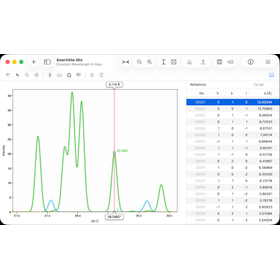
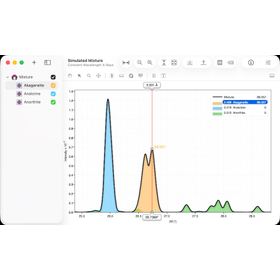
In the field of energy, particularly in the research and development of batteries, structural analysis of materials is essential for performance improvement. The performance of batteries is greatly influenced by the crystal structures of electrode materials and electrolytes, necessitating precise structural analysis using powder diffraction data. CrystalDiffract is a powerful tool for accurately understanding the structures of battery materials and aiding in material design. 【Use Cases】 - Crystal structure analysis of battery materials - Phase analysis of electrode materials - Structural evaluation of electrolytes 【Benefits of Implementation】 - Clarification of the relationship between material structure and performance - Contribution to the improvement of battery performance - Increased efficiency in research and development

  • wv_fraction.png
  • cd_igor.png
  • leucite-films.jpg
  • anorthite-mix.jpg
  • simulated-mixture.jpg
  • simulated-phase-transition.jpg
  • crystal
  • X-ray Diffraction Equipment
  • Analysis Software

Added to bookmarks

Bookmarks list

Bookmark has been removed

Bookmarks list

You can't add any more bookmarks

By registering as a member, you can increase the number of bookmarks you can save and organize them with labels.

Free membership registration

Graph Creation for Vibration Analysis in the Automotive Industry 'Igor Pro'

A powerful data analysis and graph creation tool that supports automotive vibration analysis.

In the automotive industry, various vibration analyses are required to improve vehicle performance and ensure safety. In particular, accurately capturing and analyzing vibration data affecting the vehicle body and components while driving is essential for design improvements and troubleshooting. Inadequate analysis can lead to overlooking potential issues and delays in the development cycle. Igor Pro contributes to the efficiency and accuracy of vibration analysis in the automotive industry by allowing the import of vast amounts of vibration data and performing everything from advanced analysis to graphing in a consistent manner. 【Use Cases】 - Importing and analyzing driving test data - Frequency analysis of vibrations affecting components - Visualization of vibration modes in structural analysis - NVH (Noise, Vibration, Harshness) analysis 【Benefits of Implementation】 - Rapid and accurate analysis of vibration data - Identification of problem areas and application for design improvements - Shortening of development cycles and cost reduction - Increased efficiency in report generation

  • IPROS13908241772582738462.png
  • Software (middle, driver, security, etc.)
  • Graph Analysis
  • Analysis Software

Added to bookmarks

Bookmarks list

Bookmark has been removed

Bookmarks list

You can't add any more bookmarks

By registering as a member, you can increase the number of bookmarks you can save and organize them with labels.

Free membership registration

Analysis of durability test data for the automotive industry using 'FlexPro'

Rapid and accurate analysis of durability test data in the automotive industry.

In the automotive industry, durability testing requires detailed analysis of a wide range of test data to ensure product reliability and safety. It is particularly important to detect subtle changes and anomalies early from the vast amounts of data generated during long-term testing, in order to identify product weaknesses. Inadequate analysis increases the risk of product quality deterioration and recalls. "FlexPro" addresses these challenges by consistently supporting everything from data import to analysis, visualization, and documentation. 【Use Cases】 - Analysis of long-term durability test data for automotive parts - Evaluation of vehicle test data under various environmental conditions - Analysis of complex test results involving vibration, temperature, humidity, etc. - Failure mode analysis and reliability assessment 【Benefits of Implementation】 - Time savings through rapid import and analysis of test data - Detailed data evaluation through diverse analysis functions - Increased efficiency in analysis tasks due to intuitive operability - Smooth sharing of results through reporting features

  • 08.jpg
  • FlexPro_01.png
  • FlexPro_02.png
  • FlexPro_03.png
  • FlexPro_04.png
  • oscilloscope
  • Time-frequency measurements
  • Data Logger
  • Analysis Software

Added to bookmarks

Bookmarks list

Bookmark has been removed

Bookmarks list

You can't add any more bookmarks

By registering as a member, you can increase the number of bookmarks you can save and organize them with labels.

Free membership registration

FlexPro for Analyzing Vibration Data in Aerospace

Vibration analysis in the aerospace field, quickly and accurately.

In the aerospace field, vibration analysis is essential to ensure the safety and performance of aircraft. Particularly in testing and development under extreme conditions, it is necessary to accurately capture and analyze everything from subtle vibrations to complex resonance phenomena. Inadequate analysis can increase design risks and potentially impact reliability. The measurement data analysis software 'FlexPro' addresses these challenges by directly importing binary data from various measurement instruments and utilizing advanced analysis capabilities. 【Usage Scenarios】 - Structural vibration analysis of aircraft and rockets - Vibration data analysis in durability testing of engines and components - Environmental vibration simulation in outer space - Performance evaluation and risk reduction during the development phase 【Benefits of Implementation】 - Rapid import and analysis of vibration data - Visualization of phenomena through detailed graph creation - Utilization of specialized analysis functions such as FFT and order analysis - Increased efficiency through documentation of analysis results

  • 08.jpg
  • FlexPro_01.png
  • FlexPro_02.png
  • FlexPro_03.png
  • FlexPro_04.png
  • oscilloscope
  • Time-frequency measurements
  • Data Logger
  • Analysis Software

Added to bookmarks

Bookmarks list

Bookmark has been removed

Bookmarks list

You can't add any more bookmarks

By registering as a member, you can increase the number of bookmarks you can save and organize them with labels.

Free membership registration

Analysis of wave data and tidal data for marine engineering - 'FlexPro'

Streamlining the analysis of wave impact. From data import to analysis and visualization.

In the field of ocean engineering, particularly in the evaluation of wave effects, accurate analysis and visualization of complex measurement data are required. It is important to efficiently process a wide range of data to gain precise insights into the impact of waves on structures and the analysis of oceanographic data. Inadequate data analysis can potentially affect prediction accuracy and safety assessments. The measurement data analysis software "FlexPro" consistently supports these challenges, from data import with a button click to analysis, graphing, and document creation, contributing to the efficiency of research and development. 【Usage Scenarios】 - Analysis of wave data, tidal data, and flow velocity data - Evaluation of wave loads on structures - Response analysis of marine structures - Data analysis for environmental impact assessments 【Benefits of Implementation】 - Direct import of binary data from various measurement instruments - Equipped with analysis functions necessary for wave impact evaluation, such as digital filters, FFT, and statistical analysis - Output of analysis results in easy-to-understand graphs and reports - Streamlining the research and development process and supporting rapid decision-making

  • 08.jpg
  • FlexPro_01.png
  • FlexPro_02.png
  • FlexPro_03.png
  • FlexPro_04.png
  • oscilloscope
  • Time-frequency measurements
  • Data Logger
  • Analysis Software

Added to bookmarks

Bookmarks list

Bookmark has been removed

Bookmarks list

You can't add any more bookmarks

By registering as a member, you can increase the number of bookmarks you can save and organize them with labels.

Free membership registration

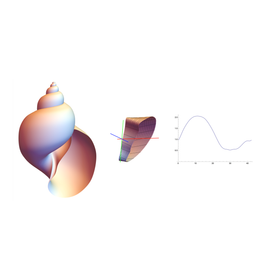
Molecular Structure Visualization and Analysis for Pharmaceuticals 'Mathematica'

Molecular modeling ideas, leading to rapid results. Equipped with countless functions.

In the pharmaceutical industry, molecular modeling requires advanced computational power and flexible data processing for the analysis and simulation of complex molecular structures. Particularly in the early stages of new drug development, accurately predicting the properties of candidate compounds and efficiently screening them significantly impacts the speed and success rate of research and development. Inadequate analysis tools can lead to increased time and costs, as well as potential delays in development. 'Mathematica' serves as an integrated system with countless built-in functions, providing a partner for the realization of ideas and research and development. 【Usage Scenarios】 - Visualization and analysis of molecular structures - Simulation of compound property predictions - Exploration of candidate compounds in drug design - Protein structure analysis - Applications in chemoinformatics 【Effects of Implementation】 - Improved computational efficiency in molecular modeling - Shortened research and development cycles - Promotion of new discoveries and insights - Extraction of insights from complex data

  • 1_WSM_window.jpg
  • case_mathematica_k_03.png
  • v103_10.png
  • IPROS15020293275197320398.png
  • Mathematical processing
  • Visualization
  • Other research software
  • Analysis Software

Added to bookmarks

Bookmarks list

Bookmark has been removed

Bookmarks list

You can't add any more bookmarks

By registering as a member, you can increase the number of bookmarks you can save and organize them with labels.

Free membership registration

Data Feature Extraction for Data Science: 'Mathematica'

Seamlessly from idea to result in data science pattern recognition.

In the field of data science, it is essential to extract meaningful patterns from complex data and utilize them for predictions and decision-making. Particularly in pattern recognition, high-precision analysis and rapid presentation of results significantly influence the speed of research and development. Inadequate analysis tools can lead to oversights and incorrect conclusions. 'Mathematica' is equipped with outstanding capabilities in all areas of technical computation in data science, including neural networks and machine learning, and strongly supports advanced analysis in pattern recognition. 【Usage Scenarios】 - Feature extraction from large datasets - Development of anomaly detection algorithms - Pattern identification in image recognition - Trend analysis of time series data 【Benefits of Implementation】 - Improved pattern recognition accuracy - Reduced analysis time - Promotion of new insights discovery - Enhanced efficiency in research and development

  • 1_WSM_window.jpg
  • case_mathematica_k_03.png
  • v103_10.png
  • IPROS15020293275197320398.png
  • Mathematical processing
  • Visualization
  • Other research software
  • Analysis Software

Added to bookmarks

Bookmarks list

Bookmark has been removed

Bookmarks list

You can't add any more bookmarks

By registering as a member, you can increase the number of bookmarks you can save and organize them with labels.

Free membership registration

Traffic Volume Data Analysis and Future Forecasting for Transportation 'Mathematica'

Seamlessly predict traffic flow. It has countless built-in functions.

In the field of transportation, accurate traffic flow predictions are required for urban planning, infrastructure development, and accident prevention. In particular, predictions that take into account complex traffic networks and diverse vehicle movements are essential for efficient road operations and ensuring safety. Inadequate predictions can lead to worsening congestion and increased accident risks. 'Mathematica' is a processing system that incorporates countless functions available in the fields of science and engineering, supporting complex calculations and analyses in traffic flow predictions. 【Application Scenarios】 - Analysis of traffic volume data and future predictions - Optimization of signal control - Simulation of congestion occurrence - Operation planning for public transportation 【Effects of Implementation】 - Realization of more accurate traffic flow predictions - Mitigation of congestion and reduction of travel time - Increased efficiency in urban planning and infrastructure development - Establishment of a safe traffic environment

  • 1_WSM_window.jpg
  • case_mathematica_k_03.png
  • v103_10.png
  • IPROS15020293275197320398.png
  • Mathematical processing
  • Visualization
  • Other research software
  • Analysis Software

Added to bookmarks

Bookmarks list

Bookmark has been removed

Bookmarks list

You can't add any more bookmarks

By registering as a member, you can increase the number of bookmarks you can save and organize them with labels.

Free membership registration

Lightweight Design Using FEM Analysis Tools for Automobiles

Is that CAE correct? Achieving weight reduction while maintaining the strength of automotive parts with FEMtools!

In the automotive industry, lightweighting of components is essential for improving fuel efficiency and reducing environmental impact. In lightweight design, it is necessary to optimize the amount of material used while maintaining strength. FEM analysis tools enable strength evaluation during the design phase and contribute to reducing the number of prototypes. FEMtools provides the latest V&V methods that seamlessly connect design, experimentation, and analysis, strongly supporting the lightweight design of automotive components. 【Application Scenarios】 - Design of automotive components - Lightweight design - Strength evaluation 【Benefits of Implementation】 - Improved fuel efficiency through lightweighting of components - Shortened design period - Reduced prototyping costs

  • 01.jpg
  • 02.jpg
  • Other analyses
  • Analysis Software

Added to bookmarks

Bookmarks list

Bookmark has been removed

Bookmarks list

You can't add any more bookmarks

By registering as a member, you can increase the number of bookmarks you can save and organize them with labels.

Free membership registration

Fluid analysis software for gear pumps, 'Simerics MP+'.

Simulate the flow characteristics of positive displacement pumps such as gear pumps and vane pumps! A CFD software specialized for pumps that other CFD software struggles with!

Simerics MP+ is a fluid simulation tool designed to calculate the transient characteristics of various volumetric pumps, compressors, and valves. It is developed based on the thermal fluid simulation tool Simerics MP and utilizes all the features of Simerics MP. 【The following fluid analyses are possible】 ■ Free surface flow ■ Flow considering the compressibility of air contained in liquids ■ Pressure pulsation and water hammer effects ■ Coupling of pump flow with the rigid body motion of valves and cam rings ■ Flow in low to medium vacuum conditions ■ Compressible flow (subsonic) ■ Cavitation ■ Time variation of flow field (velocity vectors, pressure), flow rate, fluid forces, and torque The biggest strength is the ability to automatically create meshes even for clearances in the micrometer range, which is difficult for other general-purpose fluid analysis software!! Recently, there has been an increase in achievements with oil pumps for automobiles and construction machinery, with examples such as vane pumps for power steering and CVTs, and trochoid pumps for engine lubrication. *There is a lot of information that cannot be posted online. Particularly, we encourage you to see the actual mesh creation and movement through a demo presentation!!

  • Thermo-fluid analysis
  • Analysis Software

Added to bookmarks

Bookmarks list

Bookmark has been removed

Bookmarks list

You can't add any more bookmarks

By registering as a member, you can increase the number of bookmarks you can save and organize them with labels.

Free membership registration

Fluid analysis software Simerics MP+ for vane pumps.

Simulate the flow characteristics of volumetric pumps such as vane pumps! A CFD software specialized for pumps that other CFD software struggles with!

Simerics MP+ is a fluid simulation tool designed to calculate the transient characteristics of various volumetric pumps, compressors, and valves. It is developed based on the thermal fluid simulation tool Simerics MP and utilizes all the features of Simerics MP. 【The following fluid analyses are possible】 ■ Free surface flow ■ Flow considering the compressibility of air contained in liquids ■ Pressure pulsation and water hammer effects ■ Coupling of pump flow with the rigid body motion of valves and cam rings ■ Flow in low to medium vacuum conditions ■ Compressible flow (subsonic) ■ Cavitation ■ Time variation of flow field (velocity vectors, pressure), flow rate, fluid forces, and torque The greatest strength is the ability to automatically create meshes even for clearances in the µm range, which is difficult for other general-purpose fluid analysis software!! Recently, there has been an increase in achievements with oil pumps for automotive and construction machinery, such as vane pumps for power steering and CVTs, and trochoidal pumps for engine lubrication. *There is a lot of information that cannot be posted online. Especially, please see the actual mesh creation and movement in a demo presentation!!

  • Thermo-fluid analysis
  • Analysis Software

Added to bookmarks

Bookmarks list

Bookmark has been removed

Bookmarks list

You can't add any more bookmarks

By registering as a member, you can increase the number of bookmarks you can save and organize them with labels.

Free membership registration

A tool for maximizing equipment performance using big data.

Analyze the failure characteristics specific to facilities, equipment, and devices from failure information and create a database! This will lead to actual actions that reduce customer opportunity loss.

◆Do you have any of the following concerns?◆ - You have collected failure information but don't know what to do with it. - You want to effectively utilize the collected failure information. - You want to conduct your own analysis based on the failure information but don't know the best method. - You want to connect the results of your analysis to actions that will reduce opportunity loss. ◆Organizing Failure Information Data and Building a System◆ Our company addresses the above concerns by: 1. Clarifying the problem awareness. 2. Presenting and selecting the key performance indicators (KPIs) that should be calculated. 3. Creating a database of failure information. 4. Conducting analysis using the current failure data. 5. Considering actions derived from the analysis results. 6. Building a system to carry out steps 1 to 5. We assist in organizing failure information and building a system that allows customers to select actions that are likely to reduce defects and failures leading to opportunity loss based on the analysis results. The above content assumes that failure information has been collected in advance, but we can also accommodate situations where failure information is extremely limited or not collected. (※1) ※1: Please contact us separately if you would like to see detailed materials.

  • others
  • Analysis Software

Added to bookmarks

Bookmarks list

Bookmark has been removed

Bookmarks list

You can't add any more bookmarks

By registering as a member, you can increase the number of bookmarks you can save and organize them with labels.

Free membership registration

Particle Method 3D Rarefied Fluid Analysis Software 'DSMC-Neutrals'

Analysis of gas flow under low pressure conditions can be performed with analysis software that also supports rarefied gases (rarefied fluids).

**Features** - Adopts unstructured mesh, allowing for calculations that directly reflect the complex shapes of actual devices. - High parallel efficiency enables quick computation results even for large-scale geometries. - Utilizes a particle method, ensuring convergence to a solution even with poor-quality computational grids, unlike fluid models. - Comprehensive technical support ensures that even those new to simulation or busy with experiments can reliably achieve results. **Supports Various Cases** - Simulation of rarefied gas flow in a vacuum chamber. - Simulation of thin film generation in semiconductor manufacturing. - Chemical vapor deposition (CVD), organic light-emitting diode (OLED), molecular beam epitaxy (MBE). - Film deposition simulations involving chemical reactions like CVD. **Outputs Various Calculation Results** - Calculation of chemical reactions. - Calculation of chemical reactions from Arrhenius-type reaction data. - Calculation of dissociation, recombination, and molecular (atomic) exchange reactions. - Ability to set multiple reaction equations on the GUI. *For more details, please refer to the catalog or feel free to contact us.*

  • Other analyses
  • Contract Analysis
  • Analysis Software

Added to bookmarks

Bookmarks list

Bookmark has been removed

Bookmarks list

You can't add any more bookmarks

By registering as a member, you can increase the number of bookmarks you can save and organize them with labels.

Free membership registration

Fluid analysis software for valves, 'Simerics MP+'

Simulate the flow characteristics of valves and volumetric pumps! A CFD software specialized for valves and pumps, which other CFD software struggles with!

Simerics MP+ is a fluid simulation tool designed to calculate the transient characteristics of various valves, pumps, and compressors. It is developed based on the thermal fluid simulation tool Simerics MP and utilizes all the features of Simerics MP. 【The following fluid analyses are possible】 ■ Free surface flow ■ Flow considering the compressibility of air contained in liquids ■ Pressure pulsation and water hammer effects ■ Coupling of pump flow with the rigid body motion of valves and cam rings ■ Flow in low to medium vacuum conditions ■ Compressible flow (subsonic) ■ Cavitation ■ Time variation of flow field (velocity vectors, pressure), flow rate, fluid forces, and torque The greatest strength is the ability to automatically create meshes even for clearances in the micrometer range, which is difficult for other general-purpose fluid analysis software!! In addition to valve analysis, there has been an increase in achievements for automotive and construction machinery oil pumps, such as vane pumps for power steering and CVTs, and trochoidal pumps for engine lubrication. *There is a lot of information that cannot be posted online. Especially, we encourage you to see the actual mesh creation and movement through a demonstration!

  • Thermo-fluid analysis
  • Contract Analysis
  • simulator
  • Analysis Software

Added to bookmarks

Bookmarks list

Bookmark has been removed

Bookmarks list

You can't add any more bookmarks

By registering as a member, you can increase the number of bookmarks you can save and organize them with labels.

Free membership registration