We have compiled a list of manufacturers, distributors, product information, reference prices, and rankings for Analysis software.
ipros is IPROS GMS IPROS One of the largest technical database sites in Japan that collects information on.

Analysis software Product List and Ranking from 285 Manufacturers, Suppliers and Companies | IPROS GMS

Last Updated: Aggregation Period:Jul 29, 2026~Aug 25, 2026
This ranking is based on the number of page views on our site.

Analysis software Manufacturer, Suppliers and Company Rankings

Last Updated: Aggregation Period:Jul 29, 2026~Aug 25, 2026
This ranking is based on the number of page views on our site.

  1. ウェーブフロント 本社 Kanagawa//software
  2. null/null
  3. 日本イーエスアイ Tokyo//software
  4. 4 ミューテック Tokyo//software
  5. 5 日本ケイデンス・デザイン・システムズ社 Kanagawa//software

Analysis software Product ranking

Last Updated: Aggregation Period:Jul 29, 2026~Aug 25, 2026
This ranking is based on the number of page views on our site.

  1. Lighting and optical analysis software "Lighting Simulator CAD" Camerium
  2. Fatigue Life Prediction Analysis Software 'FEMFAT' マグナ・インターナショナル・ジャパン マグナパワートレイン・ECS(Engieering Center Steyr)
  3. Welding analysis software SYSWELD/VisualAssembly 日本イーエスアイ
  4. 4 Impact and Collision Analysis Software PAM-CRASH 日本イーエスアイ
  5. 5 Network Camera Recording Playback and Image Analysis Software KxViewPro4 ネットカムシステムズ

Analysis software Product List

1051~1080 item / All 1293 items

Displayed results

磁場解析ソフト 【μ-EXCEL 誘導加熱版】

材料特性は磁場解析と温度解析用が必要!高周波コイルは加熱ON/余熱OFFが設定できます!

IHクッキングは誘導加熱原理を使っています。高周波コイルで発生した磁場をお鍋の底に当てると渦電流が発生します、ここまでが磁場解析。渦電流は発熱を起こしお鍋の底からお水へ熱が伝わり温度が上昇します、ここは熱解析。誘導加熱は狙った場所を短時間で加熱できるので、様々なところに利用されています 詳細は【解析ノウハウ.com】の「NO.019 ex誘導加熱版の紹介 」をご覧ください ポイントはこちら ・誘導加熱によりワークの温度変化を見ます ・渦電流は磁場解析で求めるのでモデルに空間が必要 ・渦電流はワーク表面を薄く流れるので、メッシュを細かく ・材料特性は磁場解析と温度解析用が必要 ・高周波コイルは加熱ON/余熱OFFが設定できる

  • Other analyses
  • Analysis software

Added to bookmarks

Bookmarks list

Bookmark has been removed

Bookmarks list

You can't add any more bookmarks

By registering as a member, you can increase the number of bookmarks you can save and organize them with labels.

Free membership registration

Magnetic Field Analysis Software 【μ-EXCEL Basics of Electromagnetic Field Analysis / Materials】

Electromagnetic phenomena, Maxwell's equations, from analysis examples to the finite element method! Explained using illustrations and diagrams.

This document introduces the world of electromagnetic simulation, covering electromagnetic phenomena, Maxwell's equations, and examples of analysis using the finite element method. It is an excerpt from "Analysis Know-How.com," a video site for analysis know-how by μ-EXCEL. The explanations are made easy to understand using illustrations and graphs. We encourage you to read it. 【Contents】 ■ Electromagnetic phenomena ■ Maxwell's equations ■ Vector operations ■ Numerical calculations ■ Finite element method ■ Motor analysis ■ Other analyses 【We have launched Analysis Know-How.com (https://mu-excel.com)!】 - In the "Home" menu, you can find a list of know-how collections. - By clicking the "View Details" button, you can access know-how points and videos. - In the "Category" menu, you can filter by genre and series. - Use "Search by Keyword" to further narrow down related videos. - In the "Blog," we will introduce updated videos as they become available. ★ You can download sample software from the link below. *For more details, please refer to the PDF document or feel free to contact us.

  • Other environmental equipment
  • Analysis software

Added to bookmarks

Bookmarks list

Bookmark has been removed

Bookmarks list

You can't add any more bookmarks

By registering as a member, you can increase the number of bookmarks you can save and organize them with labels.

Free membership registration

Magnetic Field Analysis Software 【μ-EXCEL Mutech Rakuten Market Store】

Familiar usability based on Excel. Full-scale thermal, structural, and electromagnetic field analysis available for subscription at a low price. *Benefits included.

"μ-Excel" is an affordable software for thermal, structural, and electromagnetic field analysis. It operates on Excel, allowing for professional simulations with a familiar interface. The software is structured in a series based on analysis themes, each equipped with dedicated macros for easy use. You can purchase the subscription version of this product at the newly opened Mutech Rakuten Market store. 【Features】 ■ Input and output data are stored in sheets, allowing for flexible data processing. ■ Implements necessary tools for finite element analysis, such as modelers and meshers. ■ Easy condition setting, with results obtainable in just a few minutes. ■ Adopts 2D or axisymmetric finite element methods. ■ Equipped with DXF import functionality and a material database feature. *For more details, please download the PDF or feel free to contact us. ★ We are celebrating the grand opening of the Mutech Rakuten Market store! ★ - Target product: μ-Excel Subscription New 3-Month License - Benefit: 2000 yen OFF coupon - Period: February 8, 2022 (Tuesday) 10:00 to March 1, 2022 (Tuesday) 9:59

  • simulator
  • Analysis software

Added to bookmarks

Bookmarks list

Bookmark has been removed

Bookmarks list

You can't add any more bookmarks

By registering as a member, you can increase the number of bookmarks you can save and organize them with labels.

Free membership registration

Electric Field Analysis Software 【μ-BEAM 3D Trajectory Analysis Software】

Consider the ion trajectories in electrostatic fields and static magnetic fields, dielectrics, electrodes, conductors, coils, magnets, magnetic materials, and space charge!

μ-Beam is a three-dimensional trajectory analysis module for charged particles that takes into account space charge. It can simulate ion beam control. μ-Beam is the trajectory analysis module within the electromagnetic field analysis system μ-MF by Mutech. 【Features】 - Trajectory analysis of charged particles in electric and magnetic fields - Input functions for initial position, initial velocity, and assigned current of charged particles - Function to read condition setting CSV files from Excel - Specification of calculation range and automatic calculation stop function - Trajectory analysis function considering classical and relativistic effects - The trajectory calculation method employs Runge-Kutta *For more details, please request materials or view the PDF data from the download section.

  • Electron beam lithography equipment
  • Analysis software

Added to bookmarks

Bookmarks list

Bookmark has been removed

Bookmarks list

You can't add any more bookmarks

By registering as a member, you can increase the number of bookmarks you can save and organize them with labels.

Free membership registration

Electric Field Analysis Software 【μ-EXCEL Analysis Know-How Video Site】

The video contains compact content of about 1 to 2 minutes! You can easily check the topics you want to know using your smartphone or other devices.

"Analysis Know-How.com" is a website that collects videos introducing the benefits of the analysis software μ-EXCEL, provided by Mutech, which is easy, fast, and suitable for initial assessments, along with analysis know-how. The videos are compact, lasting about 1 to 2 minutes, and allow for filtered searches by keywords and categories. You can easily check the items you want to know during your spare time using your smartphone or other devices. In the "Home" menu, you can find a list of know-how collections, with the "View Details" button allowing you to view the key points and videos of the know-how, the "Category" menu lets you narrow down by genre or series, and "Keyword Search" further refines related videos. In the "Blog," we will introduce updated and additional videos as they become available. μ-EXCEL is available as a subscription service for 9,800 yen per month (excluding tax). Additionally, Mutech offers: - Professional consulting that delves into your issues, - Affordable contract analysis and custom development services. Please feel free to contact us for more details.

  • Other analyses
  • Analysis software

Added to bookmarks

Bookmarks list

Bookmark has been removed

Bookmarks list

You can't add any more bookmarks

By registering as a member, you can increase the number of bookmarks you can save and organize them with labels.

Free membership registration

Electric Field Analysis Software 【μ-EXCEL Subscription Service】

Techniques and know-how in short video format! You can search during your free time for efficient work!

μ-EXCEL is a thermal analysis software designed for easy and quick initial assessments. It was created with the concept of simplifying operations and delivering results rapidly to first evaluate the validity of ideas. Additionally, it is offered through a subscription service that lowers the barrier to entry. For a monthly fee of 9,800 yen, users can access unlimited use, with options for monthly subscriptions that can be activated only when needed, and the ability to resume at any time. As part of a comprehensive support system, "Analysis Know-How.com" was established. This platform compiles an overview of analysis tasks and techniques into short videos. Users can efficiently search for information during their spare time on their smartphones. If you encounter difficulties, you can email an Excel file as an attachment, and experienced supporters will review it and provide feedback. For information regarding "subscription services and support," please refer to No.024 on "Analysis Know-How.com." Furthermore, Mutech offers: - Professional consulting that delves into customer issues - Affordable contract analysis and custom development services.

  • Other analyses
  • Analysis software

Added to bookmarks

Bookmarks list

Bookmark has been removed

Bookmarks list

You can't add any more bookmarks

By registering as a member, you can increase the number of bookmarks you can save and organize them with labels.

Free membership registration

電場解析ソフト 【μ-MF 3次元電磁界解析ソフト】

μ-EXCELで基本特性を確認したら、より精密な3次元解析へ!3次元電磁界解析ソフト 解析をウィザード(解析案内)が誘導!

静電磁界・渦電流からヒステリシス解析まで、3次元電磁界解析をウィザード(解析案内)が誘導します 詳細は【解析ノウハウ.com】の「NO.115 3次元電磁界解析μ-MFの紹介」をご覧ください =>https://mu-excel.com/other115.html ポイントはこちら ・μ-MFは3次元電磁界解析ソフト ・静電磁界・渦電流からヒステリシス解析まで ・解析テーマごとのウィザード(解析案内)が誘導します ・NASTRANメッシュをインポートし結果表示は標準装備 ・買取90万円から(レンタル:年間45万円、月額4万5千円から) ・メッシュ作成ソフトは別途必要、Femap,Jupiter,Aircubeがお勧め さらに ・お客様の問題に踏み込んだ、プロのコンサルティングをご提供 ・受託解析や、カスタム開発も、安価にご提供いたします

  • Other analyses
  • Analysis software

Added to bookmarks

Bookmarks list

Bookmark has been removed

Bookmarks list

You can't add any more bookmarks

By registering as a member, you can increase the number of bookmarks you can save and organize them with labels.

Free membership registration

電場解析ソフト 【μ-EXCEL 静電場版】

誘電体・電極で構成、電荷も設定可!キャパシタンスを求める事も出来ます!

静電場版では誘電体と電極による電位・電場分布を求めます、電荷を指定する事も出来ます。キャパシタンスを求める事も出来ます。詳細は【解析ノウハウ.com】の「NO.025 EX静電場版の紹介」をご覧ください ポイントはこちら ・静電場分を見る ・誘電体・電極で構成、電荷も設定可 ・等電位線、電場コンター・電場ベクトル表示 ・電場・電位グラフ出力 ・キャパシタンス算出

  • Other analyses
  • Analysis software

Added to bookmarks

Bookmarks list

Bookmark has been removed

Bookmarks list

You can't add any more bookmarks

By registering as a member, you can increase the number of bookmarks you can save and organize them with labels.

Free membership registration

Electric Field Analysis Software 【μ-EXCEL Subscription Service】

Techniques and know-how in short video format! You can search during your spare time for efficient work!

μ-EXCEL is a thermal analysis software designed for easy and quick initial assessments. It was created with the concept of simplifying operations and delivering fast results to first evaluate the effectiveness of ideas. Additionally, it is offered through a subscription service that lowers the barrier to entry. For a monthly fee of 9,800 yen, users can access the software without limits, with options for monthly subscriptions that can be activated only when needed, and the ability to resume at any time. As part of a comprehensive support system, "Analysis Know-How.com" was established. This platform compiles the basics and techniques of analysis into short videos, allowing for efficient work by searching during spare moments on a smartphone. If you encounter difficulties, you can send your Excel file as an email attachment, and an experienced supporter will provide feedback and answers. For more information on "subscription services and support," please refer to No. 024 on "Analysis Know-How.com." Furthermore: - We offer professional consulting that delves into your issues. - We also provide contract analysis and custom development at affordable prices.

  • Other analyses
  • Analysis software

Added to bookmarks

Bookmarks list

Bookmark has been removed

Bookmarks list

You can't add any more bookmarks

By registering as a member, you can increase the number of bookmarks you can save and organize them with labels.

Free membership registration

Electric field analysis software 【μ-EXCEL Free demo version・Free trial version】

Download now! [Excel-based simulation software] - Easy to use even for on-site personnel - [Exhibited at the Mechanical Components Exhibition]

"μ-Excel" is a low-cost thermal, structural, and electromagnetic analysis software that overturns the common belief that "analysis software is expensive." It operates on Excel, allowing for professional simulations with a familiar user experience. 【Do you have any of these concerns?】 - You don't need the advanced features of expensive analysis software... - You want analysis results right away... - You're worried about learning how to operate the analysis software... For those people, a subscription service is recommended! - You can use it for unlimited access for just 9,800 yen for one month. - You can choose from multiple themes, such as magnetic field analysis and temperature analysis. - A free trial version is now available for web download. - It operates in Excel, enabling professional simulations with a familiar user experience. - Analysis and development are also possible. ▽ Download now from the "Sample Software" at the bottom of the page! ▽ ▽ You can also watch the user experience in videos; search for "Analysis Know-How.com"! ▽ *Analysis is possible in various scenarios. Induction heating version (trial version available) / Static magnetic field version (trial version available) / Electrostatic field version (trial version available) / Heat conduction version (trial version available) / Electromagnetic force version / Magnetization torque version / Stress version / Induction machine version / Mold cooling version / Dielectric stress version / Ion beam version.

  • simulator
  • Analysis software

Added to bookmarks

Bookmarks list

Bookmark has been removed

Bookmarks list

You can't add any more bookmarks

By registering as a member, you can increase the number of bookmarks you can save and organize them with labels.

Free membership registration

Trajectory Analysis Software 【μ-BEAM 3D Trajectory Analysis Software】

Consider the ion trajectories in electrostatic and magnetic fields, dielectrics, electrodes, conductors, coils, magnets, magnetic materials, and space charge!

μ-Beam is a three-dimensional trajectory analysis module for charged particles that takes into account space charge. It can simulate ion beam control. μ-Beam is the trajectory analysis module within the electromagnetic field analysis system μ-MF by Mutech. 【Features】 - Trajectory analysis of charged particles in electric and magnetic fields - Input functions for initial position, initial velocity, and charge current - Function to read condition setting CSV files from Excel - Specification of calculation range and automatic calculation stop function - Trajectory analysis considering classical and relativistic effects - The trajectory calculation method uses Runge-Kutta *For more details, please request documentation or view the PDF data available for download.

  • Electron beam lithography equipment
  • Analysis software

Added to bookmarks

Bookmarks list

Bookmark has been removed

Bookmarks list

You can't add any more bookmarks

By registering as a member, you can increase the number of bookmarks you can save and organize them with labels.

Free membership registration

Trajectory Analysis Software 【μ-EXCEL Trajectory Analysis Version】

Consider the ion trajectories in electrostatic and magnetic fields, dielectrics, electrodes, conductors, coils, magnets, magnetic materials, and spatial electrification!

μ-Excel is analysis software that uses a two-dimensional (or axisymmetric) finite element method. The μ-Excel series consists of individual packages for each analysis theme, allowing for smooth analysis from customized input and output screens tailored to each theme. Additionally, it utilizes Excel macros in the GUI, enabling operation in a familiar Excel environment without discomfort. It is evolving into a rich variety of themes, not only for electromagnetic field analysis but also for heat, structure, fluid, and electromagnetic waves. Please look for the series that matches your theme (currently, there are a total of 11 series). 【Features】 - Analysis of electric fields and magnetic fields, and behavior analysis of ion beams in electric and magnetic fields - Start trajectory calculations with mass, charge number, initial coordinates, and initial velocity of charged particles - Calculation of electric fields, potential distributions, magnetic fields, magnetic field lines, and trajectory diagrams - Repulsive forces applied to multiple charged particles * Compared to other analysis software, it can be introduced at a lower price. The academic version is even more economical! * For details, please contact us or download the PDF.

  • simulator
  • Analysis software

Added to bookmarks

Bookmarks list

Bookmark has been removed

Bookmarks list

You can't add any more bookmarks

By registering as a member, you can increase the number of bookmarks you can save and organize them with labels.

Free membership registration

熱伝導解析ソフト 【μ-TM 誘導加熱の磁場・温度解析ソフト】

3次元誘導加熱解析ソフト、コイルの移動なども簡単に設定できます

解析に不慣れな設計・研究の方にも、手軽に操作できるソフトに仕上げています。簡単なコイル設定で、加熱コイルの移動もインターフェースで簡単に設定できます 詳細は【解析ノウハウ.com】の「063 μ-TMの紹介」をご覧ください ポイントはこちら ・誘導加熱・温度解析の専用ソフト ・加熱コイルの有限要素分割は不要 ・複雑なコイル形状やコイルの移動が簡単 ・ウィザード形式で解り易い条件設定 ・3次元誘導加熱解析をもっと身近に さらに ・お客様の問題に踏み込んだ、プロのコンサルティングをご提供 ・受託解析や、カスタム開発も、安価にご提供いたします

  • simulator
  • Analysis software

Added to bookmarks

Bookmarks list

Bookmark has been removed

Bookmarks list

You can't add any more bookmarks

By registering as a member, you can increase the number of bookmarks you can save and organize them with labels.

Free membership registration

Heat conduction analysis software 【μ-EXCEL Mold Cooling Version】

You can see the design of the mold cooling circuit, the cooling process of pressed products, and the temperature rise process during the insertion and ejection cycle!

μ-Excel is analysis software that uses a two-dimensional (or axisymmetric) finite element method. It consists of individual packages for each analysis theme, allowing for smooth analysis through customized input and output screens for each theme. Additionally, it utilizes Excel macros in the GUI, enabling operation in a familiar Excel environment without discomfort. Furthermore, it can be introduced at a lower cost compared to other analysis software, with an even better deal for the academic version! It is evolving into a rich variety of themes, not only for electromagnetic field analysis but also for heat, structure, fluid, and electromagnetic waves. Please look for the series that matches your theme (currently, there are a total of 11 series). 【Features】 - Designed for cooling circuit design of press parts using molds - Settings for initial temperature of press parts, position, number, and heat absorption of cooling pipes on the mold side - Calculation of unsteady temperature during the cooling process after pressing and repeated insertion of new press parts - Ability to set heat transfer coefficients based on pressing pressure - Display of temperature changes *For more details, please contact us or download the PDF.

  • simulator
  • Analysis software

Added to bookmarks

Bookmarks list

Bookmark has been removed

Bookmarks list

You can't add any more bookmarks

By registering as a member, you can increase the number of bookmarks you can save and organize them with labels.

Free membership registration

熱伝導解析ソフト 【μ-EXCEL 誘導加熱版】

材料特性は磁場解析と温度解析用が必要!高周波コイルは加熱ON/余熱OFFが設定できます!

IHクッキングは誘導加熱原理を使っています。高周波コイルで発生した磁場をお鍋の底に当てると渦電流が発生します、ここまでが磁場解析。渦電流は発熱を起こしお鍋の底からお水へ熱が伝わり温度が上昇します、ここは熱解析。誘導加熱は狙った場所を短時間で加熱できるので、様々なところに利用されています 詳細は【解析ノウハウ.com】の「NO.019 ex誘導加熱版の紹介 」をご覧ください ポイントはこちら ・誘導加熱によりワークの温度変化を見ます ・渦電流は磁場解析で求めるのでモデルに空間が必要 ・渦電流はワーク表面を薄く流れるので、メッシュを細かく ・材料特性は磁場解析と温度解析用が必要 ・高周波コイルは加熱ON/余熱OFFが設定できる

  • Other analyses
  • Analysis software

Added to bookmarks

Bookmarks list

Bookmark has been removed

Bookmarks list

You can't add any more bookmarks

By registering as a member, you can increase the number of bookmarks you can save and organize them with labels.

Free membership registration

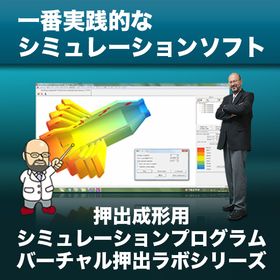
Virtual Extrusion Lab Series for Chemical Formulations

Analysis software specialized in optimal design and stable molding developed by world authorities.

In the chemical industry, the formulation process is a critical challenge regarding product quality and cost efficiency. In particular, formulation design in extrusion molding is a key factor that influences product performance, and even slight differences in formulation can lead to molding defects or reduced yield. The Virtual Extrusion Lab series addresses challenges in extrusion molding with easy operation and supports optimal formulation design. 【Use Cases】 - Formulation design in extrusion molding - Analysis of molding defects - Cost reduction 【Benefits of Implementation】 - Improved quality through optimal formulation design - Cost reduction by decreasing molding defects - Shortened development time through simulation

  • Extrusion Machine
  • Analysis software

Added to bookmarks

Bookmarks list

Bookmark has been removed

Bookmarks list

You can't add any more bookmarks

By registering as a member, you can increase the number of bookmarks you can save and organize them with labels.

Free membership registration

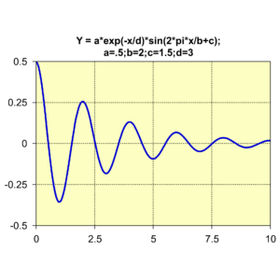
Visualization of Geological Data 'KaleidaGraph' for Earth Science Researchers

Strongly supports data visualization and analysis in geoscience research.

In geoscience research, data visualization and analysis are essential for understanding phenomena and building models. It is necessary to handle complex data from geological surveys, meteorological data analysis, and studies on environmental changes, revealing the underlying patterns and relationships. KaleidaGraph provides scientifically accurate graphing and advanced data analysis capabilities to address these challenges. This enables researchers to effectively visualize data, understand complex phenomena, and clearly express research results. 【Usage Scenarios】 - Visualization and analysis of geological data - Analysis of meteorological data and model building - Analysis of data related to environmental changes - Analysis of earthquake data - Visualization of topographical data 【Benefits of Implementation】 - Enhanced understanding of phenomena through data visualization - Increased efficiency in research through advanced data analysis - Clear expression of research results - Improved expressive power of data through various graph formats

  • Kaleida_01.png
  • Kaleida_02.png
  • Kaleida_03.png
  • kaleida_1110_350.png
  • Statistical analysis
  • Visualization
  • Other analyses
  • Analysis software

Added to bookmarks

Bookmarks list

Bookmark has been removed

Bookmarks list

You can't add any more bookmarks

By registering as a member, you can increase the number of bookmarks you can save and organize them with labels.

Free membership registration

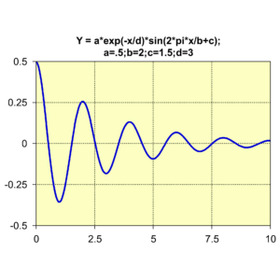
"KaleidaGraph" for analysis in engineering simulation.

Standard tools for graph creation and data analysis.

In the field of engineering simulations, data visualization and detailed analysis are essential. To understand complex simulation results and identify areas for improvement, accurate graph creation and advanced data analysis capabilities are required. KaleidaGraph was developed to meet these needs. 【Usage Scenarios】 - Visualization of simulation results - Trend analysis through data analysis - Report creation 【Effects of Implementation】 - Promotion of understanding of simulation results - Data-driven decision making - Improvement of research efficiency

  • Kaleida_01.png
  • Kaleida_02.png
  • Kaleida_03.png
  • kaleida_1110_350.png
  • Statistical analysis
  • Visualization
  • Other analyses
  • Analysis software

Added to bookmarks

Bookmarks list

Bookmark has been removed

Bookmarks list

You can't add any more bookmarks

By registering as a member, you can increase the number of bookmarks you can save and organize them with labels.

Free membership registration

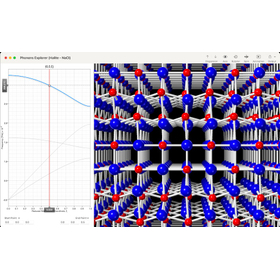
"CrystalMaker" for improving the accuracy of behavior prediction in environmental science.

Visualizing crystal structures and molecular structures to contribute to the analysis of pollutants.

In the field of environmental science, particularly in the analysis of pollutants, it is essential to accurately understand the structure of substances. Detailed structural analysis at the molecular level is required for the identification of pollutants, prediction of their behavior, and formulation of countermeasures. CrystalMaker supports the resolution of these challenges by visualizing crystal and molecular structures. 【Application Scenarios】 - Structural analysis of pollutants in soil and water quality - Structural analysis of particulate matter in the atmosphere - Elucidation of the interactions between pollutants and the environment 【Effects of Implementation】 - Improved accuracy in the identification and behavior prediction of pollutants - Formulation of effective environmental measures - Promotion of visualization and sharing of research results

  • CrystalMaker_0.png
  • building-spinel.jpg
  • crystalviewer-viewer.jpg
  • IPROS6962750492815757754.png
  • crystal
  • X-ray Diffraction Equipment
  • Other physical property measurements and component analysis
  • Analysis software

Added to bookmarks

Bookmarks list

Bookmark has been removed

Bookmarks list

You can't add any more bookmarks

By registering as a member, you can increase the number of bookmarks you can save and organize them with labels.

Free membership registration

Clarifying the Deterioration Mechanism for Food Science: 'CrystalMaker'

Scientifically supporting food quality management.

In the field of food science, it is essential to analyze the structure and composition of food in detail to maintain its quality and ensure safety. In particular, the crystal structure and molecular structure of food have a significant impact on its texture, shelf life, and flavor, making it important to accurately understand these structures. CrystalMaker contributes to food quality management by visualizing and analyzing the crystal and molecular structures of food. [Application Scenarios] - Analysis of the crystal structures of food additives and ingredients - Analysis of the relationship between food storage conditions and crystal structures - Elucidation of the relationship between food texture, flavor, and molecular structures [Effects of Implementation] - Understanding the mechanisms of food quality deterioration - Development of technologies to extend the shelf life of food - Development of new textures and flavors in food

  • CrystalMaker_0.png
  • building-spinel.jpg
  • crystalviewer-viewer.jpg
  • IPROS6962750492815757754.png
  • crystal
  • X-ray Diffraction Equipment
  • Other physical property measurements and component analysis
  • Analysis software

Added to bookmarks

Bookmarks list

Bookmark has been removed

Bookmarks list

You can't add any more bookmarks

By registering as a member, you can increase the number of bookmarks you can save and organize them with labels.

Free membership registration

"SingleCrystal" that supports defect analysis for semiconductors.

Generate dynamic diffraction patterns in collaboration with CrystalMaker.

In the semiconductor industry, accurately identifying defects in crystal structures is essential to ensure product quality and reliability. Defects can lead to decreased device performance and failures, resulting in lower yields. SingleCrystal supports defect analysis by simulating diffraction patterns from single crystals and enabling comparisons with observed patterns. Through collaboration with CrystalMaker, it also enables the generation of dynamic diffraction patterns based on structural data. 【Use Cases】 * Defect analysis using X-rays, neutrons, and TEM * Simulation of diffraction patterns and comparison with experimental results * Visualization and understanding of crystal structures 【Benefits of Implementation】 * Accelerated identification of defects and investigation of causes * Improved product quality and yield enhancement * Increased efficiency in research and development

  • SingleCrystal_jp_1110_350.png
  • crystal
  • X-ray Diffraction Equipment
  • Other physical property measurements and component analysis
  • Analysis software

Added to bookmarks

Bookmarks list

Bookmark has been removed

Bookmarks list

You can't add any more bookmarks

By registering as a member, you can increase the number of bookmarks you can save and organize them with labels.

Free membership registration

Analysis of Diffraction Patterns for Materials Science 'SingleCrystal'

Generate dynamic diffraction patterns in conjunction with CrystalMaker.

In the field of materials science, understanding the precise relationship between crystal structures and diffraction patterns is essential for structural determination. In particular, to obtain accurate structural information from diffraction experimental data such as X-ray, neutron, and TEM, comparing simulations with experimental results becomes crucial. SingleCrystal supports the efficiency of structural determination by simulating diffraction patterns from single crystals and facilitating comparisons with experimental data. 【Use Cases】 - Analysis of diffraction patterns in X-ray diffraction, neutron diffraction, and TEM experiments - Identification and refinement of crystal structures - Simulation of diffraction patterns and comparison with experimental data 【Benefits of Implementation】 - Reduction of analysis time through automatic indexing of diffraction patterns - Visualization of structural data and dynamic generation of diffraction patterns in collaboration with CrystalMaker - Support for a wide range of structural analyses through simulation functions compatible with various experimental forms

  • SingleCrystal_jp_1110_350.png
  • crystal
  • X-ray Diffraction Equipment
  • Other physical property measurements and component analysis
  • Analysis software

Added to bookmarks

Bookmarks list

Bookmark has been removed

Bookmarks list

You can't add any more bookmarks

By registering as a member, you can increase the number of bookmarks you can save and organize them with labels.

Free membership registration

SingleCrystal for crystal structure analysis of biomaterials

Dynamically generate diffraction patterns of biomaterials in collaboration with CrystalMaker.

In the research and development of biomaterials, structural analysis of materials is essential for understanding their properties and developing better materials. In particular, analysis using X-ray diffraction and electron microscopy is an important method for examining the crystal structure of materials in detail. SingleCrystal supports these analyses and streamlines the structural analysis of biomaterials. By introducing SingleCrystal, it becomes easier to simulate and analyze the diffraction patterns of biomaterials, contributing to the acceleration of research and development. 【Usage Scenarios】 - Crystal structure analysis of biomaterials - Analysis of X-ray diffraction and electron microscopy data - Evaluation of material properties 【Effects of Introduction】 - Promotion of structural understanding through visualization of diffraction patterns - Improvement of experimental efficiency through simulation - Automation of indexing using a unique grid tool

  • SingleCrystal_jp_1110_350.png
  • crystal
  • X-ray Diffraction Equipment
  • Other physical property measurements and component analysis
  • Analysis software

Added to bookmarks

Bookmarks list

Bookmark has been removed

Bookmarks list

You can't add any more bookmarks

By registering as a member, you can increase the number of bookmarks you can save and organize them with labels.

Free membership registration

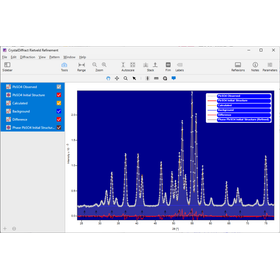
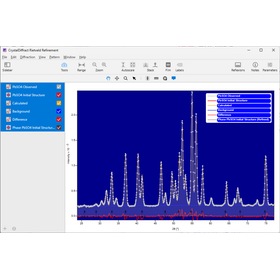
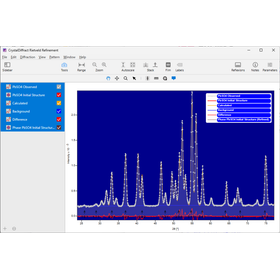
Diffraction Data Analysis for Materials Science 'CrystalDiffract'

Refinement of powder diffraction data using the Rietveld method.

In the field of materials science, the identification of substances is an important challenge in the development of new materials and quality control. Powder diffraction data is a crucial source of information for determining the crystal structure of substances, but analyzing the data requires specialized knowledge and time. In particular, advanced analytical techniques are needed for samples containing multiple substances or for the identification of trace components. CrystalDiffract supports efficient analysis of powder diffraction data with its refinement capabilities using the Rietveld method. 【Use Cases】 - Identification of crystal structures in the research and development of new materials - Detection of foreign matter in quality control - Composition analysis of multiphase mixtures 【Benefits of Implementation】 - Accelerated substance identification through high-precision crystal structure analysis - Easy data analysis without the need for specialized knowledge - Quantitative analysis of each component in multiphase mixtures

  • wv_fraction.png
  • cd_igor.png
  • leucite-films.jpg
  • anorthite-mix.jpg
  • simulated-mixture.jpg
  • simulated-phase-transition.jpg
  • crystal
  • X-ray Diffraction Equipment
  • Analysis software

Added to bookmarks

Bookmarks list

Bookmark has been removed

Bookmarks list

You can't add any more bookmarks

By registering as a member, you can increase the number of bookmarks you can save and organize them with labels.

Free membership registration

Precision of Data for Pharmaceuticals with 'CrystalDiffract'

Refinement of pharmaceutical crystal structures using the Rietveld method.

In the pharmaceutical industry, the crystal form of a drug significantly affects its efficacy and stability. Accurate identification of crystal forms and precise structural analysis are essential for the success of drug development. Crystal structure analysis using powder diffraction data plays a crucial role in quality control and formulation design of pharmaceuticals. CrystalDiffract supports the refinement of data in the crystal structure analysis of drugs. 【Use Cases】 - Analysis of polymorphism in active pharmaceutical ingredients - Identification of crystal forms in formulations - Evaluation of crystallinity in quality control 【Benefits of Implementation】 - Improvement in drug quality - Reduction in development time - Enhancement of research efficiency

  • wv_fraction.png
  • cd_igor.png
  • leucite-films.jpg
  • anorthite-mix.jpg
  • simulated-mixture.jpg
  • simulated-phase-transition.jpg
  • crystal
  • X-ray Diffraction Equipment
  • Analysis software

Added to bookmarks

Bookmarks list

Bookmark has been removed

Bookmarks list

You can't add any more bookmarks

By registering as a member, you can increase the number of bookmarks you can save and organize them with labels.

Free membership registration

Crystal structure analysis for semiconductor thin films 'CrystalDiffract'

Refinement of thin film powder diffraction data using the Rietveld method.

In the field of semiconductor thin films, structural analysis of thin films is a crucial factor that influences product quality and performance. In particular, accurately understanding the crystal structure and composition of thin films is essential for comprehending device characteristics and conducting optimal designs. Powder diffraction data is an important source of information for analyzing the structure of thin films, but refining the data requires advanced technology and expertise. CrystalDiffract was developed to address this challenge. 【Usage Scenarios】 - Crystal structure analysis of thin films - Structural evaluation of multilayer films - Composition analysis of thin film materials 【Benefits of Implementation】 - Accurate information regarding the structure of thin films - Optimization of device design - Increased efficiency in research and development

  • wv_fraction.png
  • cd_igor.png
  • leucite-films.jpg
  • anorthite-mix.jpg
  • simulated-mixture.jpg
  • simulated-phase-transition.jpg
  • crystal
  • X-ray Diffraction Equipment
  • Analysis software

Added to bookmarks

Bookmarks list

Bookmark has been removed

Bookmarks list

You can't add any more bookmarks

By registering as a member, you can increase the number of bookmarks you can save and organize them with labels.

Free membership registration

[For the Pharmaceutical Industry] Dynamic Analysis Data Processing and Graphing 'Igor Pro'

Efficient processing, graphing, and automation of pharmacokinetic analysis data.

In the pharmaceutical industry, pharmacokinetic analysis requires the accurate import of vast experimental data from subjects, detailed analysis, and the visual representation of results in easily understandable graphs. In particular, the accuracy of the analysis results and the rapid process leading to report creation are emphasized as they are directly linked to the speed of new drug development. Our software, 'Igor Pro,' integratively supports the entire workflow from data processing to analysis, graph creation, and report generation, contributing to the efficiency of research and development. 【Usage Scenarios】 - Calculation and graphing of pharmacokinetic parameters - Analysis of blood concentration trends - Automation of the process from data collection to analysis and report creation - Data acquisition through integration with external devices 【Benefits of Implementation】 - Increased efficiency and time savings in analysis tasks - Improved quality of graph creation - Enhanced productivity through automation of report generation - Improved accuracy of data analysis

  • IPROS13908241772582738462.png
  • Software (middle, driver, security, etc.)
  • Graph Analysis
  • Analysis software

Added to bookmarks

Bookmarks list

Bookmark has been removed

Bookmarks list

You can't add any more bookmarks

By registering as a member, you can increase the number of bookmarks you can save and organize them with labels.

Free membership registration

Integrated Analysis and Graphing for Materials Science: 'Igor Pro'

An integrated analysis and graphing tool to support the evaluation of physical properties in materials science.

In the field of materials science, accurate analysis of experimental data and clear visualization are essential for property evaluation. In particular, tools that can handle diverse data formats and perform advanced analyses are indispensable for thoroughly understanding material properties and advancing research and development. Inadequate analysis or graph creation can lead to incorrect conclusions and potential delays in research. Igor Pro supports research and development in materials science by importing vast amounts of experimental data, performing a wide range of analyses such as statistical analysis, signal processing, image analysis, and curve fitting, and creating publication-quality graphs. 【Usage Scenarios】 - Evaluation of material properties such as mechanical, thermal, and electrical characteristics - Statistical analysis and trend analysis of experimental data - Evaluation of material structures through image analysis - Comparison of simulation results with experimental data 【Benefits of Implementation】 - Rapid and accurate analysis of property evaluation data - Promotion of information sharing among stakeholders through clear graphing of research results - Streamlining of the entire process from data collection to report creation through automation

  • IPROS13908241772582738462.png
  • Software (middle, driver, security, etc.)
  • Graph Analysis
  • Analysis software

Added to bookmarks

Bookmarks list

Bookmark has been removed

Bookmarks list

You can't add any more bookmarks

By registering as a member, you can increase the number of bookmarks you can save and organize them with labels.

Free membership registration

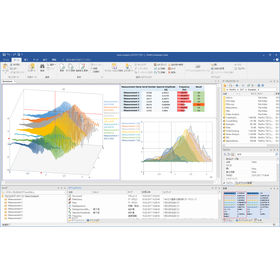
FlexPro for Tracking Time-Dependent Changes in Chemical Reactions in the Chemical Industry

Smoothly track chemical reactions from import to analysis and visualization.

In the chemical industry, tracking reactions requires the accurate acquisition of experimental data and detailed analysis, which are essential for process optimization and quality control. Accurately understanding reaction rates, changes in product concentrations, and the behavior of by-products is key to efficient research and development as well as production management. Insufficient data analysis can lead to incorrect conclusions and inefficient processes. The measurement data analysis software "FlexPro" addresses these challenges by importing various data, including binary data from diverse measuring instruments, and executing advanced analysis and visualization with the click of a button. 【Usage Scenarios】 - Tracking the temporal changes of chemical reactions - Evaluating catalytic activity - Analyzing material balances - Optimizing process parameters 【Benefits of Implementation】 - Supporting the elucidation of reaction mechanisms - Efficient analysis and reporting of experimental data - Shortening the research and development cycle

  • 08.jpg
  • FlexPro_01.png
  • FlexPro_02.png
  • FlexPro_03.png
  • FlexPro_04.png
  • oscilloscope
  • Time-frequency measurements
  • Data Logger
  • Analysis software

Added to bookmarks

Bookmarks list

Bookmark has been removed

Bookmarks list

You can't add any more bookmarks

By registering as a member, you can increase the number of bookmarks you can save and organize them with labels.

Free membership registration

Analysis of vibration, strain, and temperature data for construction using 'FlexPro'

Streamlining data analysis for structural integrity. From import to analysis and visualization.

In the construction industry, particularly in the field of structural integrity, accurate analysis of various measurement data is required to evaluate the safety and durability of structures. Detailed analysis of data such as vibrations, strains, and temperatures is crucial for understanding the condition of structures, which is important for maintenance management and renovation planning. Inadequate data analysis can lead to the oversight of potential risks. FlexPro efficiently imports, analyzes, and visualizes these complex measurement data to support the assessment of structural integrity. 【Usage Scenarios】 - Vibration data analysis of structures - Long-term monitoring of strain gauge data - Assessment of the impact of temperature changes on structures - Data analysis for seismic performance evaluation - Regular structural integrity checks for maintenance management 【Benefits of Implementation】 - Enables objective evaluation of structural health - Supports the formulation of accurate maintenance management plans based on data - Contributes to the early detection of potential risks - Reduces time and costs through the efficiency of analysis work

  • 08.jpg
  • FlexPro_01.png
  • FlexPro_02.png
  • FlexPro_03.png
  • FlexPro_04.png
  • oscilloscope
  • Time-frequency measurements
  • Data Logger
  • Analysis software

Added to bookmarks

Bookmarks list

Bookmark has been removed

Bookmarks list

You can't add any more bookmarks

By registering as a member, you can increase the number of bookmarks you can save and organize them with labels.

Free membership registration