1~45 item / All 285 items
Displayed results
Filter by category

Added to bookmarks
Bookmarks listBookmark has been removed
Bookmarks listYou can't add any more bookmarks
By registering as a member, you can increase the number of bookmarks you can save and organize them with labels.
Free membership registration
Contact this company
Inquiry FormBefore making an inquiry
Download Profile1~45 item / All 285 items
Filter by category

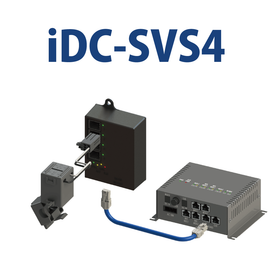
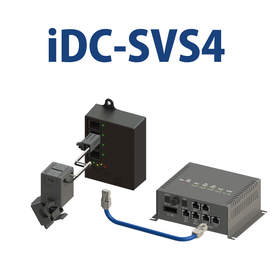
DC-SVS4 is a system that allows for remote centralized monitoring of current, power, temperature, humidity, and other parameters in distribution boards of data centers and communication facilities. It supports initial installation in our distribution boards and conducts load testing and equipment configuration before shipment. This helps reduce the on-site installation workload while supporting the visualization of equipment data and the establishment of a stable monitoring environment. The MVS and SVS series sensors have surpassed a cumulative shipment of 140,000 units as of January 2021. 【Three Features】 1. Reduces installation burden with initial installation in distribution boards Initial installation in our distribution boards is possible. By conducting load tests and registering master units for expansion before shipment, it minimizes the workload on-site and leads to a smoother installation. 2. Supports a wide range of measurements including current, power, temperature, and humidity It can measure AC current, DC current, power, temperature, humidity, and more. 3. Temporarily stores measurement data even during communication outages The relay device can temporarily store measurement data in internal memory. In the event of communication outages due to network construction or server maintenance, it supports the prevention of data loss by transmitting the stored data once communication is restored.
Added to bookmarks
Bookmarks listBookmark has been removed
Bookmarks listYou can't add any more bookmarks
By registering as a member, you can increase the number of bookmarks you can save and organize them with labels.
Free membership registration
The iDC-SVS4 is an optimal remote monitoring system for centralized monitoring of distribution board operation status, having surpassed a cumulative shipment of 140,000 units (as of January 2021). 【Three Key Points】 1. It can be initially installed in our distribution boards, allowing for cost-effective visualization. Additionally, pre-shipment load testing and registration of master units for expansion can be conducted in advance, enabling hassle-free implementation. 2. We offer various measurement modules and sensors that are in high demand in data centers and communication buildings, including single-phase two-wire power, three-phase three-wire power, single-phase three-wire power, AC current (60A, 100A, 200A, 400A, 600A), DC current (50A, 100A, 250A, 500A), temperature, and humidity. 3. The relay device can store measurement values for 2 days or 7 days in internal memory, so even if it stops due to network construction or server maintenance, it can send the accumulated measurement values after resuming, preventing data loss. (Note 1) This is the combined value of MVS and SVS series sensors. (Note 2) The storage period depends on the system used.
Added to bookmarks
Bookmarks listBookmark has been removed
Bookmarks listYou can't add any more bookmarks
By registering as a member, you can increase the number of bookmarks you can save and organize them with labels.
Free membership registration
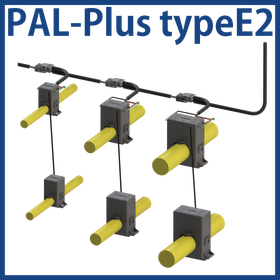
Product Overview The “PAL-Plus typeE2” is an IoT sensor with built-in communication capabilities that enables simplified cumulative energy measurement. We offer four sensor models supporting rated currents of 125A, 250A, 400A, and 630A. Using a 2-CT measurement method, this Modbus-compatible sensor provides more accurate power monitoring even in environments with unbalanced loads. Three Key Features High Compatibility: Adopts Modbus RTU protocol for easy integration into existing systems. Safe and Simple Installation: Split-clamp design allows installation without shutting down operating equipment. Ultra-Compact Design: Built-in communication functionality enables easy deployment even in locations with multiple measurement points. What is Simplified Measurement? Based on preset voltage and power factor values, the sensor calculates simplified cumulative energy and power from measured current values. It can also output cumulative current values, providing consistent reference data for energy monitoring. Compatible with single-phase 3-wire and three-phase 3-wire systems. For more details about the product and simplified measurement, please feel free to contact us.
Added to bookmarks
Bookmarks listBookmark has been removed
Bookmarks listYou can't add any more bookmarks
By registering as a member, you can increase the number of bookmarks you can save and organize them with labels.
Free membership registration
The “PAL-Plus typeE” is an IoT sensor equipped with a built-in communication function that enables simplified cumulative energy measurement. It supports five sensor models for rated currents of 60A, 125A, 250A, 400A, and 630A. This solution provides a cost-effective and simple way to visualize power consumption for each facility. Key Features High Compatibility: Utilizes the Modbus RTU communication protocol, ensuring excellent versatility and easy integration with existing systems. Non-Stop Installation: The split-clamp sensor design allows safe and simple installation without halting equipment operation. Compact Design: Built-in communication functionality enables ultra-compact sensors, making installation easy even when multiple measurement points are required. About Simplified Measurement Based on preset voltage and power factor values, the sensor calculates simplified cumulative energy and power from the measured current. It also outputs cumulative current values, providing consistent reference data for energy management. Compatible with single-phase two-wire and three-phase three-wire systems. For three-phase systems, calculations are based on a balanced circuit. For more details, please contact us.
Added to bookmarks
Bookmarks listBookmark has been removed
Bookmarks listYou can't add any more bookmarks
By registering as a member, you can increase the number of bookmarks you can save and organize them with labels.
Free membership registration
To make visualization systems easier to adopt, we consolidate and package the devices required for system setup inside an indoor plastic enclosure and provide it as the “Gateway BOX”. Just prepare the following to start visualization right away: Gateway BOX PAL series sensors (as many as required) Bus cable What were the challenges before? On-site surveys for system installation required significant time and operational effort Equipment design (e.g., an enclosure/box for each facility) was required, costing both time and money With the Gateway BOX: Perform simple initial settings Connect and install the Gateway BOX and PAL series sensors—done You can build a visualization environment without troublesome on-site surveys or design processes. Gateway BOX contents: PUSHLOG: 1 unit Power supply: 1 unit (for powering PUSHLOG and PAL series sensors) AC 100V plug: 1 This is a small-scale, trial-oriented system introduction plan, ideal for customers who want to “start visualization first”.
Added to bookmarks
Bookmarks listBookmark has been removed
Bookmarks listYou can't add any more bookmarks
By registering as a member, you can increase the number of bookmarks you can save and organize them with labels.
Free membership registration
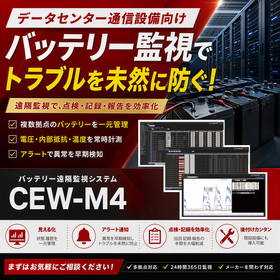
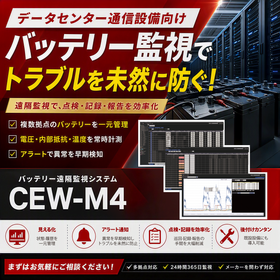
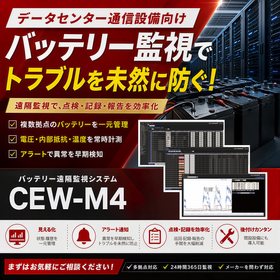
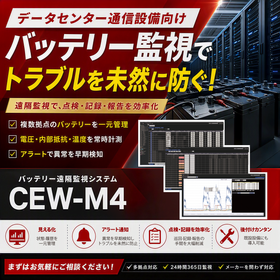
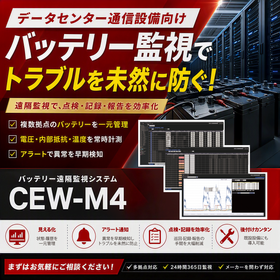
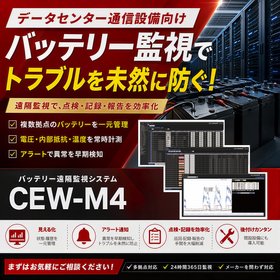
We present an application example of remote monitoring for UPS batteries utilizing the manager software CEW-M4. As an alternative to conventional manual battery inspections, we propose remote monitoring through CEW-M4. This solution enables early detection of battery conditions, contributing to reduced maintenance workload and minimized operational risks.
Added to bookmarks
Bookmarks listBookmark has been removed
Bookmarks listYou can't add any more bookmarks
By registering as a member, you can increase the number of bookmarks you can save and organize them with labels.
Free membership registration
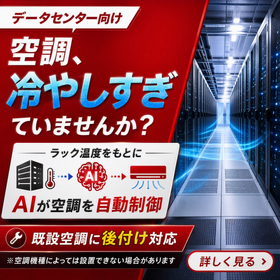
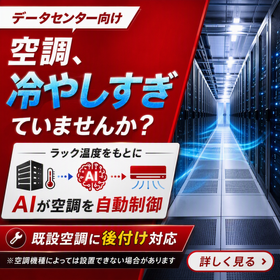
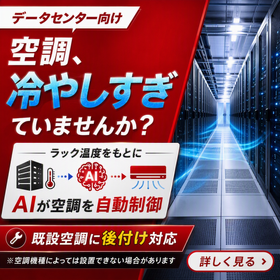
The "Smart Facility Manager (Air Conditioning AI)" is a solution that collects and analyzes the temperature around racks in data centers and server rooms, automatically controlling the air conditioning settings and operation through AI. The AI continuously analyzes temperature data to optimally control the air conditioning 24/7. It reduces excessive cooling in server rooms and aims to decrease air conditioning power consumption. Additionally, it streamlines tasks that were previously done manually by staff, such as temperature checks, air conditioning settings, and operational status verification, contributing to the efficiency and standardization of facility operations and the elimination of reliance on specific individuals. It can be retrofitted to existing packaged air conditioning systems and is compatible with various air conditioning methods such as PAC and AHU. Hexacore Inc. supports the implementation from the investigation of existing equipment, proposal of system configuration, installation work, various settings, operational checks, to the start of operations. For more details, please download the materials or feel free to contact us.
Added to bookmarks
Bookmarks listBookmark has been removed
Bookmarks listYou can't add any more bookmarks
By registering as a member, you can increase the number of bookmarks you can save and organize them with labels.
Free membership registration
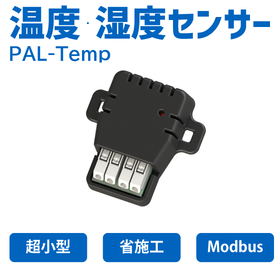
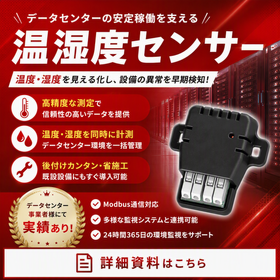
PAL-Temp is a compact IoT sensor equipped with built-in communication functionality, capable of measuring both temperature and humidity. It supports Modbus RTU communication, allowing seamless integration with a wide range of upper-level devices. Key Features 1. Modbus RTU Protocol for High Compatibility By adopting the widely used Modbus RTU protocol, PAL-Temp offers excellent compatibility and can be easily incorporated into existing systems and equipment. 2. Simple Installation with Cable Ties Installation is completed simply by securing the sensor with cable ties at the desired location. This enables easy deployment even in systems that are already in operation. 3. Compact Design with Built-in Communication Integrating communication functionality within the sensor itself enables a compact and lightweight design. PAL-Temp can be installed flexibly without constraints on location. System Integration with PAL-Plus Unit By combining PAL-Temp with the PAL-Plus Unit, which includes signal conversion to Modbus TCP and power supply functionality, users can build monitoring systems that are both space-efficient and cost-effective. Related Products We also offer a lineup of current sensors such as:PAL-Plus / PAL-Plus High-Capacity Model These sensors are capable of measuring AC current and are equipped with built-in communication features. Contact & Support For more details, please refer to our downloadable materials or feel free to contact us.
Added to bookmarks
Bookmarks listBookmark has been removed
Bookmarks listYou can't add any more bookmarks
By registering as a member, you can increase the number of bookmarks you can save and organize them with labels.
Free membership registration
Shall we start monitoring the data center equipment in more detail? The PAL-Plus 60A is a sensor that measures the AC current of racks and branch circuits. The measured data can be sent to PLCs and monitoring systems via Modbus RTU. While utilizing the existing monitoring environment, we can start with the critical circuits first. You can begin equipment monitoring using current data. 【Use Cases】 - Current monitoring by circuit for server racks - Load verification for rack PDUs and distribution boards - Addition of current data to monitoring systems - Collection of current data from multiple racks - Addition of measurement points for remote monitoring 【Benefits of Implementation】 - Check the status of each rack and circuit - Utilize the existing Modbus-compatible environment - Gradual implementation starting from critical circuits - Support daily inspections and equipment management with data - Easy to expand to monitor numerous circuits For detailed specifications, please download the product catalog and check.
Added to bookmarks
Bookmarks listBookmark has been removed
Bookmarks listYou can't add any more bookmarks
By registering as a member, you can increase the number of bookmarks you can save and organize them with labels.
Free membership registration
When adding current monitoring to existing distribution boards and power equipment, devices that can be installed according to the available space inside the panel and wiring conditions while maintaining the operation of the equipment are required. The PAL-Plus high-capacity version is a split clamp-type AC current sensor that can be installed by sandwiching it between existing wiring, allowing for installation on existing equipment without the need for power outage work. Additionally, it has built-in measurement functions and Modbus RTU (RS-485) communication capabilities, which reduces the number of devices and achieves a space-saving monitoring configuration. It is available in four models: 125A, 250A, 400A, and 630A, allowing selection based on the current values to be measured and cable diameters. 【Usage Scenarios】 - Adding current monitoring to existing equipment - Increasing monitoring points within the distribution board - Integration with existing upper-level systems 【Benefits of Implementation】 - Easy to install on existing wiring due to its split design - Reduction in the number of devices due to integrated measurement and communication - Effective use of limited space inside the panel - Transmission of current values to upper-level devices compatible with Modbus *For more details, please refer to the PDF document or feel free to contact us.
Added to bookmarks
Bookmarks listBookmark has been removed
Bookmarks listYou can't add any more bookmarks
By registering as a member, you can increase the number of bookmarks you can save and organize them with labels.
Free membership registration
When equipment troubles occur, there are things that cannot be understood just from the state at that moment. By measuring the current for each circuit with the PAL-Plus 60A and recording it in the monitoring system, you can check how the load changed before and after the trouble. By comparing it with the usual load, it becomes easier to narrow down the circuits to check. The same current data can be utilized from daily monitoring to situation confirmation during troubles. 【Usage Scenarios】 - Checking current before and after trouble occurs - Monitoring load fluctuations of racks and PDUs - Comparing A and B power supply circuits - Monitoring load of continuously operating equipment - Comparing before and after server relocation 【Benefits of Implementation】 - Checking past current states - Comparing differences with normal conditions - Narrowing down the circuits to check - Understanding load trends for each rack - Supporting operational personnel's situational judgment For methods of current measurement and detailed product specifications, please refer to the product catalog.
Added to bookmarks
Bookmarks listBookmark has been removed
Bookmarks listYou can't add any more bookmarks
By registering as a member, you can increase the number of bookmarks you can save and organize them with labels.
Free membership registration
To connect the current data from equipment to IoT applications and remote monitoring, it is necessary to confirm not only the measurement performance but also the communication method and the connection configuration with higher-level devices. The PAL-Plus large-capacity version is a sensor with built-in communication functionality that measures alternating current and outputs it via Modbus RTU (RS-485). By combining it with Modbus-compatible PLCs, BMS, SCADA, and IoT gateways, you can consider equipment monitoring that leverages existing infrastructure. Being an integrated measurement and communication unit helps keep the configuration clear and contributes to space-saving within the panel. [Challenges] Want to incorporate current data into higher-level systems / Want to organize communication and connection conditions / Want to simplify the device configuration for IoT monitoring [Expected Effects] Output current values to Modbus-compatible devices / Design monitoring configurations with PLCs, IoT gateways, and PAL-Plus units / Collaborate from data collection to visualization according to application needs The materials include examples of various system constructions, power and wiring conditions, and key specifications of the sensor and PAL-Plus unit. They can be used to clarify connections with higher-level devices. By organizing circuit conditions, power, wiring, communication specifications, and role distribution with higher-level devices in advance, it helps in comparing IoT monitoring configurations that utilize existing systems and in considering connections before implementation.
Added to bookmarks
Bookmarks listBookmark has been removed
Bookmarks listYou can't add any more bookmarks
By registering as a member, you can increase the number of bookmarks you can save and organize them with labels.
Free membership registration
To ensure stable operation of the main circuit, UPS, and PDU in a data center, it is important to continuously monitor power usage. The PAL-Plus large-capacity version is a split-core AC current sensor that supports four ratings: 125A, 250A, 400A, and 630A. It integrates measurement functions and Modbus RTU (RS-485) communication within the unit, contributing to the simplification of equipment configuration and space-saving within the panel, while assisting in monitoring power usage through the current sensor. 【Usage Scenarios】 - Current monitoring of the main circuit, UPS, and PDU - Adding remote monitoring capabilities to existing equipment - Integration with BMS, SCADA, and PLC systems 【Benefits of Implementation】 - Supports large-capacity circuits from 125A to 630A - Simplifies configuration with integrated measurement and communication - Effectively utilizes limited panel space - Compatible with Modbus-enabled higher-level devices *For more details, please refer to the PDF document or feel free to contact us.
Added to bookmarks
Bookmarks listBookmark has been removed
Bookmarks listYou can't add any more bookmarks
By registering as a member, you can increase the number of bookmarks you can save and organize them with labels.
Free membership registration
In monitoring multi-circuit equipment, it is important to design with not only the current number of monitoring points in mind but also future expansions. The PAL-Plus large-capacity version, in combination with the PAL-Plus unit, allows for the bulk collection of numerous current data. Up to 31 sensors can be connected to a single unit, and the wiring length to the final stage can accommodate up to 100 meters. Additionally, it is possible to configure a connection between the Modbus RTU on the sensor side and the Modbus TCP on the upper side. Monitoring points can be gradually increased in line with equipment expansion. 【Challenges】 - Efficiently monitor numerous circuits - Prepare for future expansions - Organize the overall system conditions 【Expected Benefits】 - Bulk monitoring of multiple currents - Expansion up to 31 units - Integration from Modbus RTU to Modbus TCP You can consider configurations ranging from small-scale to multi-point setups for main and branch circuits or multi-circuit panels. This can also be utilized for configuration confirmation before implementation, design during the addition of monitoring points, and planning for future expansions. Please take a look at the materials. For actual configuration conditions, please contact us individually.
Added to bookmarks
Bookmarks listBookmark has been removed
Bookmarks listYou can't add any more bookmarks
By registering as a member, you can increase the number of bookmarks you can save and organize them with labels.
Free membership registration
When starting to monitor large-capacity circuits, many people think, "I want to confirm if the sensors are compatible with the target equipment" or "I want to test if the communication can be stable." With the PAL-Plus large-capacity version, you can conduct evaluation from a single circuit or a small number of circuits before full-scale implementation, gradually expanding the monitoring range while confirming operational results. The PAL-Plus large-capacity version offers four types: 125A, 250A, 400A, and 630A. You can select the optimal sensor according to the target current and cable diameter. Additionally, it adopts a split clamp type that is easy to install on existing equipment and supports data collection via Modbus RTU (RS-485) communication. This allows for future expansion into remote monitoring systems. 【Challenges】 - Want to confirm compatibility/communication before full-scale implementation - Want to reduce initial costs - Want to prepare for future expansion 【Expected Benefits】 - Optimal selection from four types - Easy to retrofit with a split type - Potential for future remote monitoring expansion For more details, please check the materials or feel free to contact us.
Added to bookmarks
Bookmarks listBookmark has been removed
Bookmarks listYou can't add any more bookmarks
By registering as a member, you can increase the number of bookmarks you can save and organize them with labels.
Free membership registration
I want to add current monitoring. However, I want to make the most of the existing equipment as much as possible. With the PAL-Plus 60A, you can add current measurement points to existing racks and distribution boards. Its split clamp design makes it easy to consider retrofitting to existing wiring. Instead of replacing all the equipment at once, you can start with the circuits you want to check first. You can expand monitoring within a manageable range. 【Usage Scenarios】 - Adding current monitoring to existing racks - Retrofitting to rack PDUs or distribution boards - Adding current data to existing PLCs - Gradual expansion of monitored circuits - Load verification before equipment updates 【Benefits of Implementation】 - Start monitoring while utilizing existing equipment - Gradual implementation from necessary circuits - Easy to install in limited space within panels - Obtain data for considering equipment updates - Easily adaptable for future expansion of monitoring scope For installation methods and detailed specifications, please refer to the product catalog.
Added to bookmarks
Bookmarks listBookmark has been removed
Bookmarks listYou can't add any more bookmarks
By registering as a member, you can increase the number of bookmarks you can save and organize them with labels.
Free membership registration
When updating or expanding UPSs and servers, can you confirm the load before and after the work? The PAL-Plus 60A measures the AC current for each circuit, such as around the UPS and in rack distribution panels. By comparing the data before and after the update, you can confirm the changes in load due to equipment modifications. This sensor is designed to help you understand the current situation with data rather than just intuition when considering equipment updates or expansions. 【Usage Scenarios】 - Current comparison before and after UPS updates - Equipment updates for PDUs and distribution panels - Load confirmation before and after server expansions - Verification of A and B power circuits - Regular inspections of critical circuits 【Benefits of Implementation】 - Numerical comparison of load before and after updates - Confirmation of changes due to equipment expansions - Acquisition of current data necessary for update planning - Organization of load by rack and circuit - Support for decision-making when reviewing power capacity Please check the product catalog for detailed specifications such as measurement range and connection methods.
Added to bookmarks
Bookmarks listBookmark has been removed
Bookmarks listYou can't add any more bookmarks
By registering as a member, you can increase the number of bookmarks you can save and organize them with labels.
Free membership registration
Before adding servers, have you checked the load on the racks and PDUs? The PAL-Plus 60A measures the alternating current flowing through the branch circuits of server racks and PDUs. It allows you to check the load on a per-rack and per-circuit basis, making it useful data when considering server expansions or equipment changes. Its compact split clamp design makes it easy to retrofit existing rack distribution boards or fit into limited panel space. 【Usage Scenarios】 - Monitoring branch circuits of server racks - Measuring current of rack PDUs - Checking load on rack distribution boards - Monitoring current in UPS surrounding circuits - Checking load before and after server expansion 【Benefits of Implementation】 - Understanding load per rack and circuit - Collecting current data from multiple circuits at once - Identifying differences in load between racks - Comparing changes before and after server expansion - Gathering data to consider power capacity For ways to utilize it with racks, PDUs, and distribution boards, please refer to the product catalog.
Added to bookmarks
Bookmarks listBookmark has been removed
Bookmarks listYou can't add any more bookmarks
By registering as a member, you can increase the number of bookmarks you can save and organize them with labels.
Free membership registration
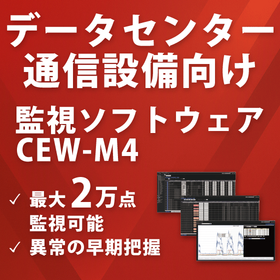
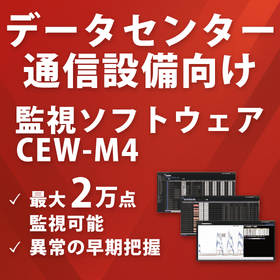
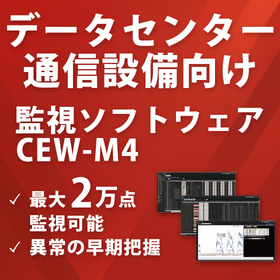
The CEW-M4 supports integration with Modbus/TCP and Modbus/RTU compatible devices and various sensors. It allows for the effective utilization of existing monitoring devices and sensor assets while expanding the monitoring range in line with the addition of equipment or measurement points. Even if the number of monitoring targets increases, it is possible to build a phased system according to the scale of operations. Modbus gateways and relay devices can each connect up to 200 units. Data on power, temperature and humidity, equipment status, and more can be aggregated on a web interface, allowing for an overview of large facilities, multiple equipment, and various locations. The collected equipment data supports graph display, map display, and CSV output. Furthermore, by utilizing alarm email notifications and alarm history management, it aids in the early detection of changes in equipment status or abnormalities. It broadly supports equipment management tasks from daily monitoring to data accumulation and analysis.
Added to bookmarks
Bookmarks listBookmark has been removed
Bookmarks listYou can't add any more bookmarks
By registering as a member, you can increase the number of bookmarks you can save and organize them with labels.
Free membership registration
Is there any bias in the load for each rack or circuit? By using the PAL-Plus 60A, you can measure the AC current of branch circuits. By comparing the collected data, you can confirm the differences in load for each rack and changes over time. It can also be utilized for comparisons before and after server expansions or configuration changes. You can gather foundational data for considering equipment operations. 【Usage Scenarios】 - Load comparison between racks and circuits - Current verification before and after server expansion - Load verification of rack PDUs and distribution boards - Identification of circuits with concentrated loads - Data collection for equipment operation 【Benefits of Implementation】 - Numerical confirmation of load for each circuit - Obtaining clues to identify load imbalances - Comparison of current before and after equipment changes - Data collection for considering power capacity - Supporting daily equipment management with data Please check the product catalog for measurement methods and detailed specifications.
Added to bookmarks
Bookmarks listBookmark has been removed
Bookmarks listYou can't add any more bookmarks
By registering as a member, you can increase the number of bookmarks you can save and organize them with labels.
Free membership registration
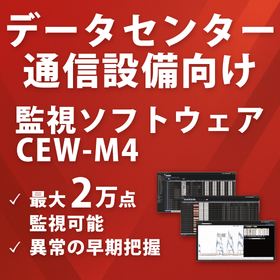
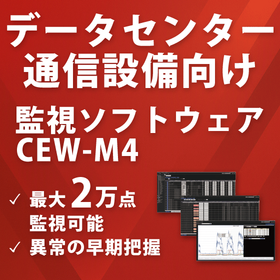
In data center facility management, the challenge is that monitoring screens and measurement data are dispersed across different locations and buildings, leading to time-consuming on-site inspections, individual confirmations, aggregations, and report preparation. Additionally, if changes in power or temperature and humidity cannot be quickly understood from a remote location, it can result in delays in verification and response. CEW-M4 is an energy and environmental monitoring software that collects measurement data from multiple sites, including current, power, energy consumption, temperature, and humidity, with a maximum of 20,000 data points, allowing for centralized monitoring via maps and graphs on a web browser. In addition to remote confirmation of equipment status, it supports comparisons between sites and equipment, as well as tracking data trends. The alarm function, which allows for setting upper and lower limits in three stages, along with alarm emails and alarm history, can also be utilized for early detection of state changes. Collected data can be output in CSV format, streamlining data organization necessary for monthly reports, audit materials, and energy consumption aggregation. It supports Modbus/TCP, Modbus/RTU, and configurations utilizing existing measurement devices can also be considered. This helps reduce the burden of inspections, confirmations, and aggregations, supporting the stable operation of data centers and server rooms. Please refer to the PDF materials for compatible devices, connection configurations, screen examples, and server requirements.
Added to bookmarks
Bookmarks listBookmark has been removed
Bookmarks listYou can't add any more bookmarks
By registering as a member, you can increase the number of bookmarks you can save and organize them with labels.
Free membership registration
With the expansion of data centers and server rooms, is the monitoring information for power, temperature, humidity, and other factors dispersed across multiple devices and screens? When information is scattered, it increases the need for on-site inspections, visual confirmations, and individual checks by responsible personnel, making it time-consuming to grasp the equipment's status. The CEW-M4 is an energy and environmental monitoring software that consolidates equipment data such as current, power, energy consumption, temperature, and humidity onto a web interface, allowing centralized monitoring of up to 20,000 points. 【Do you face any of the following challenges?】 - Monitoring screens for power meters, temperature and humidity sensors, etc., are dispersed. - Relying on on-site inspections and visual checks to confirm equipment status. - Wanting to add monitoring targets in line with the expansion of racks and equipment. 【Expected benefits from implementation】 - Consolidation of dispersed equipment information onto a web interface. - Reevaluation of monitoring tasks that depend on on-site inspections and visual confirmations. - Increased efficiency in verification tasks through graphs, maps, and alarm history. Please download the materials to check the compatible devices, connection configurations, and images of the monitoring screens.
Added to bookmarks
Bookmarks listBookmark has been removed
Bookmarks listYou can't add any more bookmarks
By registering as a member, you can increase the number of bookmarks you can save and organize them with labels.
Free membership registration
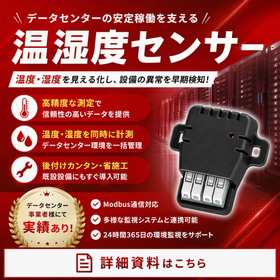
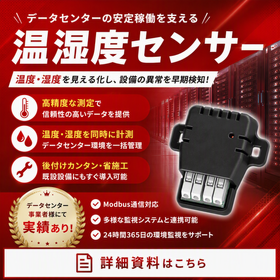
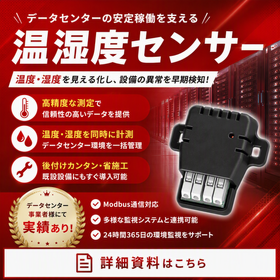
PAL-Temp is a wired temperature and humidity sensor that measures the temperature and humidity around data center racks and in machine rooms, outputting data via Modbus RTU (RS-485). In data centers, it is crucial to continuously monitor the temperature and humidity around racks to ensure the stable operation of servers and communication equipment. Since there can be localized environmental changes that are difficult to capture with just representative points in the room, measurements at multiple locations are required. [Challenges] - Want to monitor temperature and humidity around racks at multiple points - Want to add temperature and humidity data to existing monitoring systems - Want to simplify wiring and installation work when adding sensors [Benefits of Implementation] - Measure temperature and humidity around racks and in machine rooms at low cost - Measure multiple locations to understand temperature and humidity variations that are not apparent from just representative values in the room - Add temperature and humidity data to existing PLCs and monitoring systems to visualize the equipment environment *For more details, please refer to the PDF document or feel free to contact us.
Added to bookmarks
Bookmarks listBookmark has been removed
Bookmarks listYou can't add any more bookmarks
By registering as a member, you can increase the number of bookmarks you can save and organize them with labels.
Free membership registration
PAL-Temp is a Modbus-compatible temperature and humidity sensor designed to monitor the environmental conditions of data centers and server rooms. In data centers, temperature differences can occur between racks due to equipment heat generation and air conditioning conditions. It is important to have a measurement system that can check not only the overall representative values of the room but also the environment around the front and back of the racks and near the air conditioning equipment. 【Challenges】 - I want to check the intake and exhaust environment for each rack. - I want to understand localized temperature changes that cannot be identified by the average indoor temperature alone. - I want to be able to confirm changes in temperature and humidity during incidents. 【Benefits of Implementation】 - Low-cost measurement of temperature and humidity around the front and back of racks and near air conditioning equipment. - By measuring multiple locations, it is possible to confirm localized temperature rises and imbalances in temperature and humidity. - Utilize temperature and humidity data as a basis for decision-making regarding air conditioning operations and equipment environment. *For more details, please refer to the PDF document or feel free to contact us.
Added to bookmarks
Bookmarks listBookmark has been removed
Bookmarks listYou can't add any more bookmarks
By registering as a member, you can increase the number of bookmarks you can save and organize them with labels.
Free membership registration
The "CEW-M4" is a manager software compatible with the Modbus protocol that visualizes the values of various sensors and multimeters, achieving energy savings and improvements in productivity and quality. You can implement a power monitoring system that allows for easy setup and operation from the user's perspective. 【Three Key Points】 1. Various functions such as virtual sensors, comparison graphs, and map displays can be easily operated from a web browser. 2. You can efficiently manage a large number of sensors, including bulk registration via CSV files. Additionally, since most settings can be done by the operational administrator themselves, there is no need for vendor configuration changes, which can reduce costs. 3. It can accommodate up to 20,000 sensors, allowing for a wide range of system construction from small to large scale. For more details, please download the materials or feel free to contact us. | We also offer a lineup of various sensors, including AC current sensors and temperature and humidity sensors. |
Added to bookmarks
Bookmarks listBookmark has been removed
Bookmarks listYou can't add any more bookmarks
By registering as a member, you can increase the number of bookmarks you can save and organize them with labels.
Free membership registration
In data centers and server rooms, information such as power, temperature and humidity, and equipment status can be dispersed across different devices and monitoring systems. When information is split across multiple screens, it takes time to confirm issues when abnormalities occur, and expanding the monitoring range due to equipment additions can become complicated. CEW-M4 is software that aggregates data obtained from existing sensors, PLCs, and Modbus-compatible devices, allowing for centralized monitoring via a web browser. It displays current, power, energy, temperature, and humidity together, and supports early detection of abnormalities, initial decision-making, and post-response situation confirmation through alarm, history, graph, and map functions. [Challenges] - Information on power and temperature and humidity is dispersed across multiple screens. - I want to quickly confirm the equipment or location where an abnormality has occurred. - I want to check data before and after the occurrence of an abnormality in graph form. - I want to aggregate equipment information from multiple floors or locations. [Implementation Effects] - Confirm dispersed equipment data on a single screen. - Support understanding the situation and initial decision-making before on-site confirmation. - Understand abnormal locations and changes before and after occurrences. - Build a monitoring environment that utilizes existing equipment. - Gradually expand the monitoring range according to equipment additions. - Visualize power and temperature and humidity data.
Added to bookmarks
Bookmarks listBookmark has been removed
Bookmarks listYou can't add any more bookmarks
By registering as a member, you can increase the number of bookmarks you can save and organize them with labels.
Free membership registration
To implement a remote monitoring system across multiple data center sites, it is necessary to check the local conditions at each location and organize the monitoring configuration, required equipment, installation methods, and settings. Hexacore Inc. will handle everything from on-site surveys and proposals for monitoring configurations to arranging remote monitoring equipment, servers, and network devices, installing monitoring equipment in panels, software and equipment settings, inspections and tests, and operational confirmations. The monitoring system can manage up to 20 sites, allowing for role-based access control, three-tier alarms for upper and lower limits, and alarm notifications via email and other means. 【Usage Scenarios】 - Implementation of remote monitoring for multiple data center sites - When installation and configuration of monitoring equipment is required for each site - Building an environment to collectively check equipment information and alarms from multiple locations 【Benefits of Implementation】 - Ability to consider monitoring configurations tailored to the local conditions of each site - Comprehensive consultation available from equipment arrangement to installation, settings, and testing - Centralized confirmation of equipment information and alarms for multiple sites with the corresponding system - Support for establishing a monitoring environment in preparation for operational start *For more details, please refer to the PDF document or contact us.
Added to bookmarks
Bookmarks listBookmark has been removed
Bookmarks listYou can't add any more bookmarks
By registering as a member, you can increase the number of bookmarks you can save and organize them with labels.
Free membership registration
【Challenges】 Do you face any of the following challenges in monitoring data center facilities? - Want to quickly identify abnormalities in power and temperature/humidity - Want to immediately pinpoint the location of an alarm - Want to check data before and after an abnormal occurrence to investigate the cause - Want to view equipment information from multiple locations on a single screen - Want to keep monitoring data and alarm history as operational records 【You can utilize the monitoring software CEW-M4 to solve these challenges】 The monitoring software CEW-M4 is a facility monitoring software that allows centralized monitoring of current, power, energy, temperature, humidity, and equipment status in data centers, server rooms, and communication facilities via a web browser. When an abnormality is detected, it notifies you with an alarm, and you can quickly check the location of the alarm from the map display. Additionally, you can verify the time of occurrence and changes in data before and after the event through graphs and history, which supports understanding the situation during an abnormal occurrence, initial response decisions, and cause investigation. It is also possible to manage equipment information distributed across multiple data centers and communication sites in a consolidated manner. From daily equipment monitoring to post-abnormality checks and reflections, everything can be efficiently conducted on a single screen.
Added to bookmarks
Bookmarks listBookmark has been removed
Bookmarks listYou can't add any more bookmarks
By registering as a member, you can increase the number of bookmarks you can save and organize them with labels.
Free membership registration
In a data center, it is necessary to manage various equipment information, including UPS battery measurements, power, and temperature and humidity. When this information is dispersed across different equipment and monitoring systems, personnel must check multiple screens and records, which takes time for information collection and aggregation. This system collects the internal resistance, voltage, and temperature of UPS batteries and displays the current values, measurement history, comparison graphs, and alarms in a centralized manner via the monitoring software "CEW-M4" on a web browser. It also allows for connection configurations with Modbus-compatible devices, enabling the management of surrounding equipment information such as power and temperature and humidity, in addition to UPS battery information. [Implementation Effects and Solutions] - Centralized confirmation of current values, measurement history, comparison graphs, and alarms for UPS batteries via a web browser. - Streamlining the verification and aggregation of overall equipment by combining information such as power and temperature and humidity. - Supporting the expansion of monitoring targets through connection configurations tailored to the communication specifications of the target devices and existing environments. This helps reduce the burden of information collection and aggregation for data center equipment and supports the establishment of a management system that allows for a comprehensive understanding of the overall monitoring status of the equipment.
Added to bookmarks
Bookmarks listBookmark has been removed
Bookmarks listYou can't add any more bookmarks
By registering as a member, you can increase the number of bookmarks you can save and organize them with labels.
Free membership registration
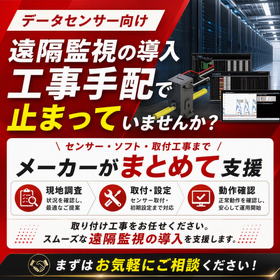
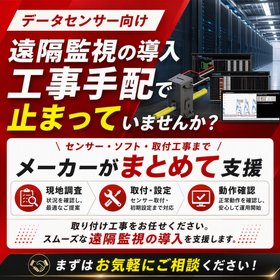
When introducing remote monitoring of data center facilities, it is necessary to coordinate multiple processes, including the consideration of the configuration of sensors, monitoring devices, servers, network equipment, and monitoring software, as well as the arrangement of equipment, installation, configuration, and operational verification. Hexacore Inc. will handle everything from on-site surveys, proposals for monitoring configurations, arranging remote monitoring devices, servers, and network equipment, installing monitoring devices in panels, configuring software and equipment, to inspections, tests, and operational confirmations, all centered around its own software and sensors. We take on the responsibility for equipment, software, and installation/configuration processes, reducing the burden of individually confirming and arranging with multiple suppliers. We support the introduction of a monitoring environment that can manage multiple sites. **Challenges** - The sources for sensors, monitoring devices, servers, and software are separate, making coordination cumbersome. - We want to request not only equipment arrangement but also installation and configuration within panels. - We want to consolidate and check equipment information and alarms from multiple sites. **Benefits of Implementation** - It is possible to consider equipment, software, and installation/configuration processes together. - The burden of confirming and arranging with multiple suppliers is reduced. - Continuous consultation is possible from equipment arrangement to installation in panels, configuration, and testing. *For more details, please refer to the PDF document or contact us.*
Added to bookmarks
Bookmarks listBookmark has been removed
Bookmarks listYou can't add any more bookmarks
By registering as a member, you can increase the number of bookmarks you can save and organize them with labels.
Free membership registration
PAL-Temp is a Modbus-compatible sensor designed to add temperature and humidity measurement points to existing monitoring systems in data centers. In data centers, there may be a need to add temperature and humidity measurement points in line with the expansion of racks and equipment. A configuration that allows measurement data to be incorporated into higher-level devices while utilizing existing PLCs and monitoring equipment is required. [Challenges] - Want to incorporate temperature and humidity data into existing PLCs and monitoring equipment - Want to add environmental measurement points in line with rack expansions - Want to consider communication configurations that match higher-level devices [Benefits of Implementation] - Add temperature and humidity measurement capabilities to existing PLCs and monitoring equipment at low cost - Add measurement points to necessary locations in line with the expansion of racks and equipment - Utilize the acquired temperature and humidity data for monitoring the environmental conditions of the data center *For more details, please refer to the PDF document or feel free to contact us.
Added to bookmarks
Bookmarks listBookmark has been removed
Bookmarks listYou can't add any more bookmarks
By registering as a member, you can increase the number of bookmarks you can save and organize them with labels.
Free membership registration
When introducing remote monitoring for data center facilities, it is necessary to coordinate multiple processes, including the configuration of sensors, monitoring equipment, servers, network devices, and monitoring software, as well as arranging equipment, installation in panels, settings, and testing. Hexacore Inc., a manufacturer of equipment, will handle everything from on-site surveys, proposals for monitoring configurations, arranging remote monitoring equipment, servers, and network devices, to installing monitoring equipment in panels, various settings, inspections, testing, and operational confirmations, all centered around its own software and sensors. By proposing a connection between equipment, software, and installation/setting processes, we reduce the burden of individually confirming and arranging with multiple suppliers. We support the introduction of a monitoring environment that allows for remote confirmation of equipment information obtained from sensors and the creation of monitoring environments for multiple sites. 【Benefits of Implementation】 - Possibility to consider equipment, software, and installation/setting processes together - Reduced burden of confirming and arranging with multiple suppliers - Continuous consultation possible from equipment arrangement to installation in panels, settings, and testing - Support for creating an environment that utilizes sensor-acquired information for monitoring - Possibility to consider configurations that allow for checking equipment information and alarms from multiple sites *For more details, please refer to the PDF document or contact us.
Added to bookmarks
Bookmarks listBookmark has been removed
Bookmarks listYou can't add any more bookmarks
By registering as a member, you can increase the number of bookmarks you can save and organize them with labels.
Free membership registration
When introducing remote monitoring for data center facilities, it is necessary to consider a configuration that includes not only sensors and monitoring devices but also servers, network equipment, and monitoring software, and to proceed with the arrangement, installation, configuration, and operation confirmation of each component. Hexacore Co., Ltd. will handle everything from on-site surveys and proposals for monitoring configurations to the arrangement of remote monitoring devices, servers, network equipment, and compatible sensors, installation of monitoring devices in panels, software and equipment configuration, inspection, and operation confirmation. By linking our proprietary software and sensors with the installation work, we reduce the burden of individually confirming and arranging equipment and tasks with multiple suppliers. We provide total support for the introduction of remote monitoring. 【Challenges】 - The suppliers for sensors, monitoring devices, servers, and software are separate. - It is time-consuming to confirm specifications for each device and adjust the installation and configuration processes. - We want to request not only equipment arrangement but also installation in panels, configuration, and testing. 【Benefits of Implementation】 - Reduces the burden of confirming and arranging with multiple suppliers. - Allows for consideration of a configuration that integrates sensors, monitoring devices, and software. - Enables continuous consultation from equipment arrangement to installation in panels, configuration, and testing. *For more details, please refer to the PDF document or contact us.*
Added to bookmarks
Bookmarks listBookmark has been removed
Bookmarks listYou can't add any more bookmarks
By registering as a member, you can increase the number of bookmarks you can save and organize them with labels.
Free membership registration
When introducing a remote monitoring system to a data center, it is necessary to coordinate multiple processes, including the consideration of the configuration of monitoring devices, sensors, servers, and software, as well as the arrangement of equipment, installation within panels, settings, inspections, and testing. Hexacore Inc. will handle everything from on-site surveys, proposals for monitoring configurations, arranging remote monitoring devices, servers, and network equipment, installing monitoring devices within panels, software and equipment settings, inspections, testing, to operational confirmation, all centered around its own software and sensors. By proposing the association of equipment, software, and installation/setting processes, we reduce the burden of individually confirming and arranging with multiple suppliers. We support the setup to ensure that the installation of equipment does not just end there, but moves towards a state where the remote monitoring system can be operationally started. [Challenges] - The sources for monitoring devices, sensors, and software are separate, making coordination cumbersome. - We want to request not only equipment arrangements but also installation within panels and various settings. - We would like to consult about inspections, testing, and operational confirmation after installation. [Benefits of Implementation] - Reduces the burden of individual confirmation and arrangement with multiple suppliers. - Allows for continuous consultation from equipment arrangement to panel installation, settings, and testing. *For more details, please refer to the PDF document or contact us.*
Added to bookmarks
Bookmarks listBookmark has been removed
Bookmarks listYou can't add any more bookmarks
By registering as a member, you can increase the number of bookmarks you can save and organize them with labels.
Free membership registration
When managing UPS equipment across multiple locations with a limited number of personnel, a significant amount of time is required for site visits, battery measurements, recording inspection results, and preparing regular reports. Furthermore, if measurement values and past inspection histories are scattered across individual files for each person in charge, it becomes cumbersome to confirm the situation before visits and to hand over responsibilities during personnel changes. This system collects the internal resistance, voltage, and temperature of UPS batteries and displays the current values, measurement history, comparison graphs, and alarms in a centralized manner via a web browser. Personnel can check the status of the equipment before visiting the site, and past histories and CSV data can be shared among stakeholders. 【Benefits and Solutions】 - Check measurement values, histories, and alarms before visits, streamlining preparation and organization of inspection targets. - Manage location-specific information on a common screen, enhancing information sharing and handover between personnel. - Utilize CSV output for inspection records and regular reports, reducing the burden of transcription, aggregation, and report creation. Since personnel can refer to the same screen and history, it allows for a management approach that is less dependent on individual memory or separate files. It supports a seamless flow from pre-visit confirmation to post-inspection recording and reporting, facilitating the establishment of a continuous equipment management system by a limited number of personnel.
Added to bookmarks
Bookmarks listBookmark has been removed
Bookmarks listYou can't add any more bookmarks
By registering as a member, you can increase the number of bookmarks you can save and organize them with labels.
Free membership registration
PAL-Temp is a Modbus-compatible sensor that measures the ambient temperature and humidity around server room equipment, providing the environmental data necessary for maintenance decisions. In data center equipment maintenance, being able to check not only electrical information but also changes in ambient temperature and humidity during abnormal occurrences is essential for troubleshooting. It is important to have a configuration that continuously collects environmental data, not just during inspections. 【Challenges】 - Unable to confirm changes in the surrounding environment during equipment abnormalities - Temporary measurements during inspections make it difficult to grasp trends - Want to add temperature and humidity measurement items to existing monitoring equipment 【Benefits of Implementation】 - Continuously measure the temperature and humidity around equipment at low cost - Understand unusual changes in temperature and humidity and use them as reference information for inspections and maintenance decisions - By combining with higher-level systems, check the temperature and humidity history before and after abnormal occurrences *For more details, please refer to the PDF document or feel free to contact us.
Added to bookmarks
Bookmarks listBookmark has been removed
Bookmarks listYou can't add any more bookmarks
By registering as a member, you can increase the number of bookmarks you can save and organize them with labels.
Free membership registration
When managing multiple data centers, the measurement values, inspection history, and alarm information of UPS batteries can easily become dispersed by location, equipment, and responsible department. Operations that require individual confirmation from personnel at each location or the collection of multiple records to create reports can take time to grasp the overall situation and compile information. This system consolidates the internal resistance, voltage, temperature, measurement history, and alarm information of UPS batteries into a common web interface. It allows for the organization of monitoring targets by location, floor, and equipment, and permissions can be set according to user roles. It creates an environment where related departments, such as facility management, electrical equipment, data center operations, and information systems, can access the same information. 【Implementation Effects and Solutions】 - Consolidates UPS battery information from multiple locations into a common web interface for centralized overall status confirmation. - Organizes monitoring targets by location, floor, and equipment, streamlining tasks related to confirmation and report creation. - Sets permissions according to user roles, supporting safe and smooth information sharing among related departments. By being able to confirm the situation based on common measurement information, it becomes easier to advance reporting between locations and align understanding between departments, leading to the standardization of management tasks.
Added to bookmarks
Bookmarks listBookmark has been removed
Bookmarks listYou can't add any more bookmarks
By registering as a member, you can increase the number of bookmarks you can save and organize them with labels.
Free membership registration
During the inspection of UPS batteries in data centers, measurement results are sometimes manually entered into paper inspection sheets or spreadsheet files, creating inspection records and maintenance reports. This method of operation not only takes time for transcribing and aggregating measurement results but also makes it cumbersome to search past data and compare between batteries and equipment. Additionally, if the recording methods differ by location or personnel, it can become difficult to share information and manage it continuously. This system collects and accumulates the internal resistance, voltage, and temperature of UPS batteries into the monitoring software "CEW-M4," clearly displaying current values, measurement history, comparison graphs, and alarm history in a web browser. By managing the entire flow from data collection to history confirmation, comparison, and data output in one system, it streamlines daily checks and recording/aggregation tasks. Measurement logs and statistical data can be output in CSV format, which can also be utilized for inspection records and maintenance reports. **[Implementation Effects and Solutions]** - Centralized accumulation of measurement values and history, streamlining recording, searching, and aggregation tasks. - Clear confirmation of changes in past values and between batteries and equipment through comparison graphs. - Utilizing CSV output for inspection records, maintenance reports, and regular reports to enhance reporting efficiency.
Added to bookmarks
Bookmarks listBookmark has been removed
Bookmarks listYou can't add any more bookmarks
By registering as a member, you can increase the number of bookmarks you can save and organize them with labels.
Free membership registration
In data centers, managing the temperature around server racks while reducing the burden of air conditioning power and management tasks is a challenge. The Smart Facility Manager (air conditioning AI) manages the temperature of server racks and analyzes collected data, allowing AI to automatically control the temperature settings and operation of the air conditioning. It helps to prevent excessive cooling and supports the reduction of labor costs and air conditioning power costs associated with temperature management. It also accommodates remote monitoring of operational status and email notifications. Hexacore Inc. supports the construction from research and proposal to operational start. 【Challenges】 - Want to properly manage the temperature around server racks - Want to review power consumption due to excessive cooling by air conditioning - Want to streamline management tasks related to temperature checks and air conditioning settings 【Implementation Effects】 - Automatic control of air conditioning temperature settings and operation by AI - Helps to prevent excessive cooling and supports the reduction of air conditioning power costs - Contributes to the reduction of labor costs associated with temperature management and improves operational efficiency For more details, please download the materials or feel free to contact us.
Added to bookmarks
Bookmarks listBookmark has been removed
Bookmarks listYou can't add any more bookmarks
By registering as a member, you can increase the number of bookmarks you can save and organize them with labels.
Free membership registration
In data centers, personnel measure a large number of UPS batteries on-site and record the results on inspection sheets, which can make inspections time-consuming and make it difficult to grasp changes during inspection intervals. This system continuously measures internal resistance, voltage, and temperature, collecting data to the monitoring software CEW-M4, which displays current values, history, comparison graphs, and alarms in a web browser. Multiple sites can also be centrally managed by location, floor, and equipment. [Challenges] - A large number of batteries are measured and recorded manually, making inspections time-consuming. - It is difficult to grasp changes during inspection intervals and the history before and after alarm occurrences. - Records are dispersed by location and personnel, making comparison and sharing cumbersome. [Implementation Effects and Solutions] - Internal resistance, voltage, and temperature can be checked via the web, streamlining daily status checks. - Changes can be understood from history and comparison graphs, supporting the consideration of inspection targets and maintenance plans. - Information from multiple locations can be centrally managed, improving information sharing and report creation among personnel. With alarm notifications based on thresholds, personnel can more easily notice changes that need to be checked, ensuring that decision-making materials from daily monitoring to on-site verification are comprehensively secured.
Added to bookmarks
Bookmarks listBookmark has been removed
Bookmarks listYou can't add any more bookmarks
By registering as a member, you can increase the number of bookmarks you can save and organize them with labels.
Free membership registration
In data centers, it is necessary to not only acquire temperature data but also to utilize it for air conditioning operations. The Smart Facility Manager (air conditioning AI) collects and analyzes temperature data around the racks, and the AI automatically controls the temperature settings and operation of the air conditioning. The reference configuration included in the materials combines temperature sensors, wireless gateways, protocol conversion gateways, air conditioning controllers, and more. Hexacore Inc. will support the construction until the operation begins. 【Challenges】 - I want to utilize temperature data around the racks for air conditioning operations. - I want to consider a configuration that links temperature sensors and air conditioning equipment. - I want to choose between cloud or on-premises solutions according to my company's operational policy. 【Implementation Effects】 - Collect and analyze temperature data around the racks for air conditioning control. - Automatic control of air conditioning temperature settings and operation by AI. - Support for construction from investigation and proposal to installation, configuration, operation verification, and start of operation. For more details, please download the materials or feel free to contact us.
Added to bookmarks
Bookmarks listBookmark has been removed
Bookmarks listYou can't add any more bookmarks
By registering as a member, you can increase the number of bookmarks you can save and organize them with labels.
Free membership registration
The control panel may experience temperature differences in various locations due to equipment heat generation and air conditioning conditions. PAL-Temp is a compact sensor that measures temperature and humidity and outputs data via Modbus RTU. By installing it in multiple locations, you can monitor localized changes that may not be evident from just a representative point. 【Challenges】I want to understand temperature imbalances within the panel / I want to record changes outside of inspection times / I want to add temperature and humidity monitoring to existing systems. 【Implementation Benefits】It supports the accumulation of multi-point data, verification before and after alarms, and the objectification of maintenance records.
Added to bookmarks
Bookmarks listBookmark has been removed
Bookmarks listYou can't add any more bookmarks
By registering as a member, you can increase the number of bookmarks you can save and organize them with labels.
Free membership registration
When managing the temperature and air conditioning settings in a server room manually, continuous checks and adjustments by the responsible personnel are necessary. The Smart Facility Manager (air conditioning AI) collects and analyzes temperature data around the racks, and based on that data, the AI automatically controls the temperature settings and operation of the air conditioning. It helps to reduce excessive cooling and supports the reduction of labor costs associated with temperature management and air conditioning electricity costs. Additionally, it assists in the construction of the system from investigation and proposal to installation work, various settings, operation confirmation, and start of operation. 【Challenges】 - Checking the temperature around the racks and adjusting air conditioning settings is labor-intensive. - I want to review electricity consumption due to excessive cooling by the air conditioning. - I would like to consult about the installation and settings necessary for the introduction of air conditioning AI all at once. 【Implementation Effects】 - Collecting and analyzing temperature data around the racks to utilize for air conditioning control. - Automatic control of air conditioning temperature settings and operation by AI. - Supporting the reduction of labor costs associated with temperature management and air conditioning electricity costs. For more details, please download the materials or feel free to contact us.
Added to bookmarks
Bookmarks listBookmark has been removed
Bookmarks listYou can't add any more bookmarks
By registering as a member, you can increase the number of bookmarks you can save and organize them with labels.
Free membership registration
The data center is equipped with numerous UPS batteries, and their inspection requires a lot of effort and time. By implementing this system, you can check the current values and measurement history of the internal resistance, voltage, and temperature of the UPS batteries, as well as alarm information, from a web browser before visiting the site. Furthermore, it supports comparison of target equipment through comparison graphs and CSV output of measurement logs, thereby assisting in the streamlining of inspection tasks from information gathering before inspections to recording and reporting after inspections. 【Challenges】 - The condition of the equipment and the items to be checked are unknown until arriving on-site. - Transcribing and aggregating measurement results takes time, and it is difficult to standardize the recording method. - Searching for and comparing past measurement values and alarm histories is labor-intensive. 【Benefits of Implementation / What Can Be Solved】 - Confirm current values, history, and alarms before the visit, and organize the inspection targets and contents to be checked. - Use comparison graphs to check differences from previous values and other equipment, thus streamlining inspection preparation. - Output measurement logs as CSV, simplifying the creation of inspection records, maintenance reports, and regular reports. By handling information before and after inspections in the same monitoring environment, it becomes easier for personnel to check past conditions even if the responsible person changes, leading to continuous maintenance management.
Added to bookmarks
Bookmarks listBookmark has been removed
Bookmarks listYou can't add any more bookmarks
By registering as a member, you can increase the number of bookmarks you can save and organize them with labels.
Free membership registration
Relying solely on visual inspection and sound during patrols to check the status of small-capacity load equipment can make it difficult to grasp load changes outside of inspection hours. PAL-Plus is a sensor that measures AC current up to 60A and has a built-in communication function that outputs data to higher-level devices via Modbus RTU. It continuously compares the current during normal operation, allowing for the confirmation of operation and stoppage, load increases and decreases, and the status during non-operating hours. 【Challenges】Want to continuously check the operating status of equipment / Want to grasp load changes that differ from normal conditions / Want to streamline patrol measurements 【Implementation Effects】Supports operational confirmation through current data / Narrowing down inspection targets / Assists in operational comparisons using historical data.
Added to bookmarks
Bookmarks listBookmark has been removed
Bookmarks listYou can't add any more bookmarks
By registering as a member, you can increase the number of bookmarks you can save and organize them with labels.
Free membership registration