


We undertake electrical work for factories, offices, and warehouses! Comparison of energy-saving equipment and electricity cost simulation. Attendance management is also possible with smart switches.


Energy-saving and visualization solutions realized through EMS.


By implementing ESCO-ONE, you can reliably reduce power consumption by 15% to 20%, which allows you to receive certification for a reduction in basic fees from the power company.


Reduce the burden on stores and offices! A management system that achieves company-wide efficient energy saving.
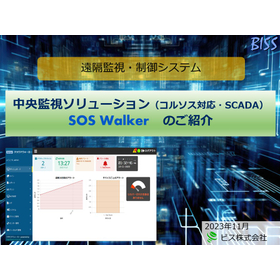

Integrated IoT device central monitoring system. It collectively monitors the status of various sensors in remote infrastructure facilities, factories, farms, warehouses, buildings, and food sales areas.
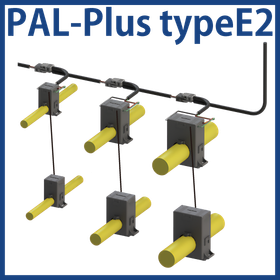

Understand the "simple electric power" of the main and branch circuits of the distribution board by circuit. Simple power and energy sensor compatible with Modbus RTU.
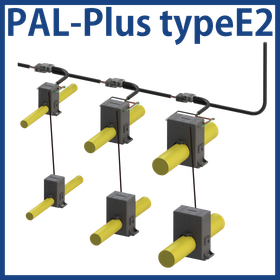
Understand the "simple electric power" of the main and branch circuits of the distribution board by circuit. Simple power and energy sensor compatible with Modbus RTU.

ESCO-ONE will assist you in reducing your energy costs with innovative ideas and methods that have never been seen before.

ESCO-ONE will assist customers in reducing their energy costs with ideas and methods that have never been seen before.


Remote monitoring of the operating status and conditions of manufacturing equipment and environmental facilities via LTE mobile routers wirelessly.


A state-of-the-art building energy management system implemented in over 75 countries and regions worldwide. Compatible with standard network protocols.


A low-cost demand controller that can quickly pay for itself even in small and medium-sized businesses.

Not only reducing demand without being noticed, but also significantly cutting down on electricity usage!

Patent obtained in December 2018! Significantly reducing demand and electricity consumption while protecting the environment!

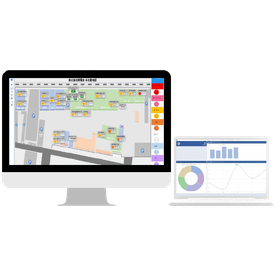

"Visualizing the condition of equipment." Achieving early detection of abnormalities and stable operation.


Consolidating data recording and display functions into the main unit! By utilizing communication software, data management and current value display on a computer are possible.

We propose a variety of devices and systems that best match the Earth, environment, and energy conservation!


Reduce office air conditioning costs by 850,000 yen annually! Start an energy-saving automatic control service as an add-on.

Reduced air conditioning costs for wholesale and retail by 1.49 million yen annually! Easy energy-saving measures with retrofitting.

Achieve demand control for air conditioning retroactively! Reduce electricity costs by up to 20% with zero initial investment.


By managing and controlling demand, it is possible to reduce the demand power and lower the basic fees of the demand contract.

The "IOG-100" is a gateway equipped with the MQTT protocol, enabling data integration with IoT platforms.

Immediately notifies of equipment abnormalities. [This is a remote monitoring device with LTE support.]

Acquisition of power consumption data using the IPv6-based "B route" communication method equipped in high-pressure smart meters.

A system for visualizing electricity usage based on the revised Energy Conservation Law and contributing to CO2 reduction for preventing global warming through solar power generation and renewable energy measurement.

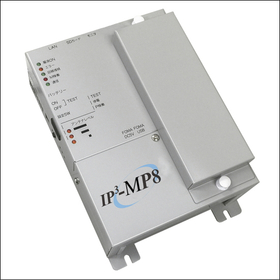
Added a gateway lineup compatible with Facility Assist for SaaS.


New demand link feature added! Bulk suppression at each location is now possible. Award-winning! Achieved reduction in electricity costs through maximum demand control.

This is an AC distribution board for data centers that adopts a unique internal structure to solve issues related to miswiring and a shortage of skilled workers.

Simplify power monitoring for each facility with smart sensors featuring built-in communication functions and an intuitive, visual manager software.

We will introduce the features of our measurement and monitoring system to address concerns such as 'I want to visualize the energy consumption of telecommunications equipment.'

We will introduce the features of our measurement and monitoring system to address concerns such as 'I want to visualize the energy usage of our factory.'

We will introduce an example of a system configuration using the "PAL series sensors × PLC," which is optimal for taking the first step towards visualizing electricity by utilizing already installed equipment.

An example of a system configuration using the "PAL Series Sensor × PUSHLOG" that enables immediate visualization of power without the need for server or network setup.

A shop specializing in IoT will help you realize visualization!

Introducing a system configuration example using the "PAL Series Sensor × CEW-M4," ideal for large-scale centralized management visualization!

The split clamp-type sensor enables easy and quick visualization of energy usage, contributing to energy savings in data centers through constant monitoring of the distribution board.

You can safely and easily install sensors using the "retrofit clamp-type sensor" without stopping the equipment currently in operation.

We would like to introduce the "Map Display" feature of the CEW-M4, which allows you to graphically display measurement values on any diagram, such as floor plans and photos.

You can start visualizing easily and at low cost with IoT sensors that have built-in communication functions.

By packaging the required equipment, you can start data visualization without time-consuming on-site surveys or complicated design processes.
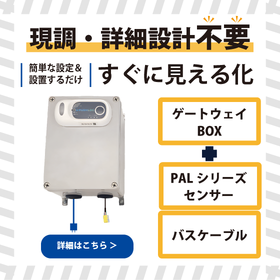
Do you think achieving equipment visualization requires complex on-site surveys and design processes? With our solution, simply installing the device makes equipment visualization possible.
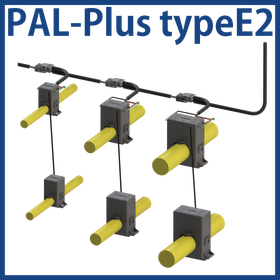
IoT sensor with built-in communication capabilities for visualizing power consumption per equipment, featuring simplified cumulative energy measurement and Modbus communication support (rated 125A to 630A)
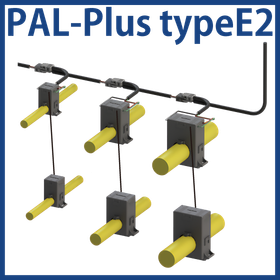
The same series also includes the PAL-Plus Type E, offering a more cost-effective solution for simplified cumulative energy measurement. Learn more here.
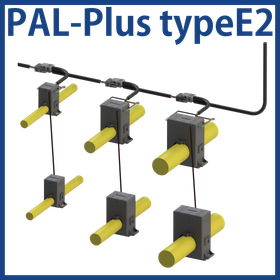
Visualize the power of the equipment and detect anomalies. Easily implementable in existing equipment with Modbus compatibility.
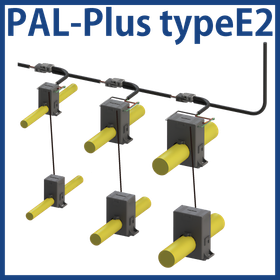
IoT sensor with built-in communication function capable of measuring simple accumulated electric power compatible with Modbus communication, visualizing power for each device (125A to 630A).
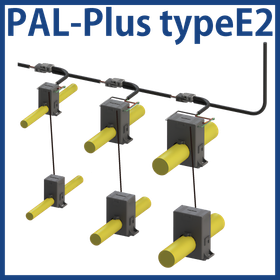
Collect simple power and simple energy using Modbus RTU (RS-485) and visualize the main and branch circuits of the distribution board.
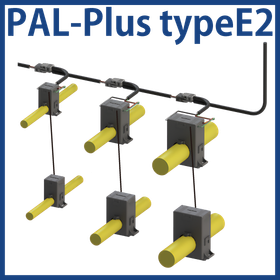
The first step in energy-saving considerations. Collecting "circuit-specific" simple power and simple energy amounts from the main and branch circuit breakers of the distribution board via Modbus RTU.
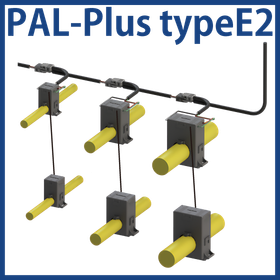
Retrofit to the distribution board to visualize by circuit. No need for power outage work with split clamps, simple power and simple energy sensors compatible with Modbus RTU.
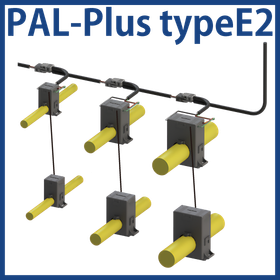
At the entrance to visualizing and IoT-enabling factories. Collect circuit-specific data from the distribution board retroactively without the need for power outage work, and link it to higher systems via Modbus RTU.
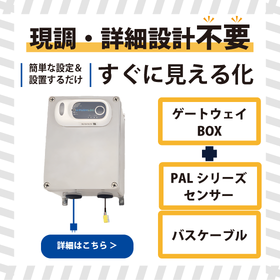
Visualize equipment easily and quickly without on-site surveys or design.
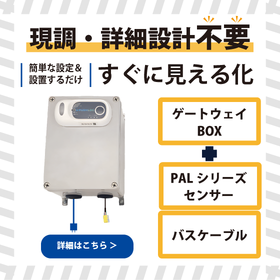
Start visualizing equipment just by connecting the sensor and gateway.
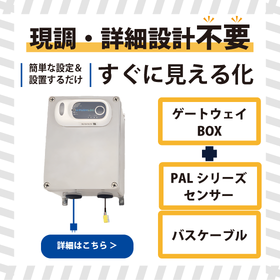
You can start visualizing energy "quickly" and "easily."
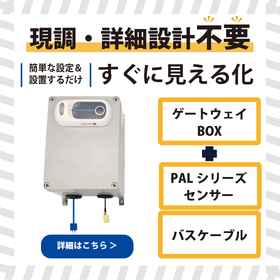
Early detection of signs using gateways and sensors.

"ESCO-ONE," a dedicated device for air conditioner outdoor units that reliably achieves energy savings and CO2 reduction without changing the comfortable indoor environment.
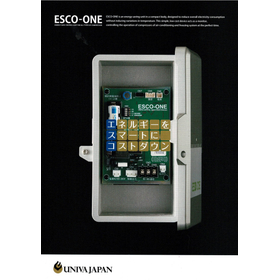
"ESCO-ONE," a dedicated device for air conditioner outdoor units that reliably achieves energy savings and CO2 reduction without changing the comfortable indoor environment.


It is an energy-saving system that maximizes the use of sunlight and achieves high efficiency through optimal control. It simultaneously realizes visualization and energy conservation. It is effective for power-saving measures.
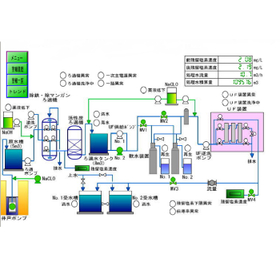

You can monitor water quality and quantity with a smartphone, and remote control is possible on-site, contributing to labor-saving! Abnormalities can be detected, responded to, and resolved immediately!


Achieve improved productivity and prevent large-scale defects! Check the reflow status in real-time remotely.

It is possible to check the operator's grounding status! Only the ON/OFF grounding monitoring function can be realized.


Reduce construction costs with a solar-powered wireless unit! It is also suitable for updates from demand monitoring.

Small but high performance! Remote monitoring and operation from a distance with a smartphone is easy.
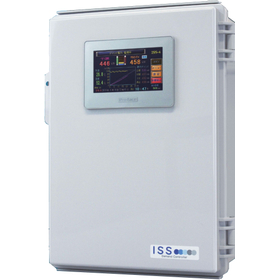
Smart energy-saving that does not compromise comfort with patented technology!


A power meter equipped with a variety of features. A compact power meter that is easy to install.


Easily installable with a rail mount type clamp CT.

To meet a wide range of needs, we offer a rich lineup of products.

A rich lineup! Various electronic power meters from Taiwan's Arch Meter company are featured!

High-precision measurement of multiple systems with a single unit! Diverse customization of wiring and configuration is possible. Easy to install.


Diverse options, top-quality design, easy installation process.


Visualization of power consumption in floors and stores! Achieving multi-circuit demand monitoring and power consumption monitoring.

A cost cutter that monitors excessive electricity use in factories, stores, and buildings!


The standard machine AirREAL is equipped with programmable digital I/O that can support various sensors. Additionally, it also includes an industrial rechargeable battery UPS.


Ideal for cutting unnecessary energy usage! Precisely control equipment such as lighting, air conditioning, and compressors to create an optimal energy environment.


Wide-ranging response to environmental issues and cost reduction measures! Energy-saving products of the gel system.


A tool for continuous monitoring of plant data! Easy installation at a low cost for rotating machinery and more.


By reducing peak power, the contracted power decreases, leading to a reduction in basic charges! An explanation of "demand."

Monitoring demand and enabling alarms with a 'peak cut method'! Significantly reduces the effort and costs of meter reading.


Easy and low-cost wireless demand monitoring!


Significant reduction in both demand and electricity usage without being noticed! Skillfully control the air conditioning according to the climate.

Contributing to decarbonization with reliable technology! Average power consumption reduced by 20%, maximum demand reduced by 50%.

Incorporating SDGs and ESG into management and aligning the overlap between corporate profits and decarbonization goals is the key to growth!

There are implementation results in various facilities such as nursing homes and general hospitals!

For companies struggling with air conditioning power consumption and CO2 reduction! We have installation experience at 3,200 companies across 9,000 locations.

Unlike conventional on/off control, achieve both comfort and energy savings with AI! Kenes' unique control reduces air conditioning electricity costs by up to 20%!

Retrofit existing air conditioning systems to reduce factory air conditioning electricity costs by up to 20%! An automatic air conditioning control service that enables energy-saving measures with zero initial costs!
No initial costs and immediate decision! Achieving peak cut while considering the comfort of the workplace environment! Balancing energy savings and comfort in factory air conditioning.
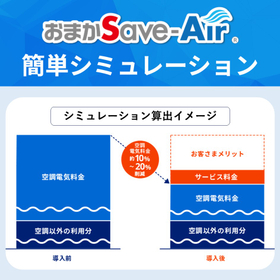
Just enter the industry and area! A simple simulation of the energy-saving effects of air conditioning with the introduction of "Omakase Save-Air."

Air conditioning control service that reduces electricity costs and CO2 emissions by approximately 10-20% with zero initial costs! Visualizing power consumption, CO2 reduction, and demand values.

Optimal control of factory air conditioning for multiple varieties and small quantities operating 24 hours a day! Achieve up to 20% power reduction! Automatic air conditioning control service that enables energy-saving measures with zero initial cost!

Annual savings of 1.5 million yen and a reduction of 21 tons of CO₂ emissions! Perfect for mass production factories with long operating hours! Energy-saving control that reduces air conditioning power consumption by up to 20%.

Reduce air conditioning power in food warehouses by up to 20%! Retrofit energy-saving control system available.

Reduce air conditioning costs by 1.36 million yen annually! Energy-saving control system with proven implementation in hotels.