We have compiled a list of manufacturers, distributors, product information, reference prices, and rankings for Analysis Equipment.
ipros is IPROS GMS IPROS One of the largest technical database sites in Japan that collects information on.

Analysis Equipment Product List and Ranking from 80 Manufacturers, Suppliers and Companies | IPROS GMS

Last Updated: Aggregation Period:Aug 05, 2026~Sep 01, 2026
This ranking is based on the number of page views on our site.

Analysis Equipment Manufacturer, Suppliers and Company Rankings

Last Updated: Aggregation Period:Aug 05, 2026~Sep 01, 2026
This ranking is based on the number of page views on our site.

  1. ルミネックス・ジャパン Tokyo//others
  2. アイテス Shiga//Electronic Components and Semiconductors
  3. DKSHマーケットエクスパンションサービスジャパン テクノロジー事業部門 Tokyo//Trading company/Wholesale
  4. 4 アズサイエンス 松本本社 Nagano//Trading company/Wholesale
  5. 5 null/null

Analysis Equipment Product ranking

Last Updated: Aggregation Period:Aug 05, 2026~Sep 01, 2026
This ranking is based on the number of page views on our site.

  1. 『xMAP INTELLIFLEXシステム』 ルミネックス・ジャパン
  2. Aites Device List アイテス
  3. Next Generation NTA Device ZetaView Evolution DKSHマーケットエクスパンションサービスジャパン テクノロジー事業部門
  4. 4 Surface and Interface Physical Property Analysis Device SAICAS EN-WA アズサイエンス 松本本社
  5. 5 Lock-in thermal analysis device "ELITE"

Analysis Equipment Product List

91~120 item / All 156 items

Displayed results

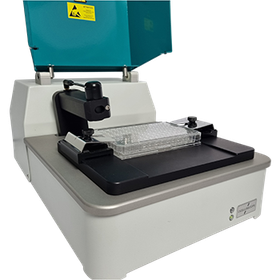
Particle Shape Image Analysis Device "PITA-04"

Achieve vast particle imaging and analysis involving tens of thousands in just a few minutes! 【Demo measurements / Can be brought in!】 Please consult with us.

By evaluating particle shape through imaging and quantifying it, we enhance the added value of powders and bulk materials beyond conventional particle size distribution measurement devices. It goes without saying that clear particle images are essential for particle image analysis. The camera's depth of field is on the order of a few microns, so the observed particles must pass precisely through the focus. Additionally, we must ensure that the observation zone is not overlapped by the particles as much as possible. The "PITA-04" has achieved a particle imaging environment with its unique planar stretching cell and high-resolution CCD camera. With the PITA-04, it is possible to reliably analyze aspects such as "the length and thickness of needle-like/fibrous particles," "the dispersion/agglomeration state of suspended particles," "whether coarse particles are single particles, agglomerated particles, or foreign substances," and "whether there are irregularities in particles with controlled shapes." 【Features】 - Clear particle images achieved through the use of a planar stretching cell - Easy measurement that anyone can perform in a short time - Capable of various measurements including heavy, large, fibrous particles and agglomeration confirmation - Compatible with organic solvents - Successful cost reduction through compact design For more details, please contact us or download the catalog.

  • Other measurement, recording and measuring instruments
  • Other powder equipment
  • Analytical Equipment and Devices
  • Analysis Equipment

Added to bookmarks

Bookmarks list

Bookmark has been removed

Bookmarks list

You can't add any more bookmarks

By registering as a member, you can increase the number of bookmarks you can save and organize them with labels.

Free membership registration

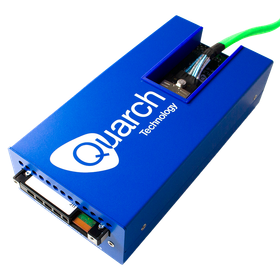
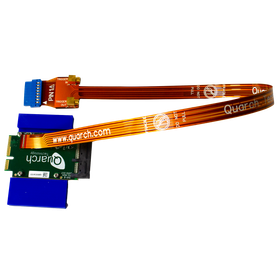
Quarch Company Introduction

Specialized solutions for hot-plugging SSDs and network devices, fault injection, and power analysis.

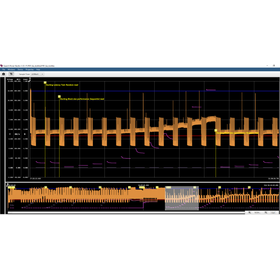
Quarch is a specialized manufacturer that provides physical layer test solutions for storage and networking equipment. It supports the latest interfaces such as PCIe Gen6 and offers hot-plug, error injection, and high-precision power analysis tools. It is adopted by major vendors worldwide and helps improve product reliability through the automation of precise physical testing that is impossible to achieve manually. ■ Hot-plug and error injection technology: With its unique "Breaker," it automates physical contact failures, signal disconnections, and timing control. It verifies system robustness through precise fault simulations in the nanosecond range. ■ Power analysis and automation tools: It measures and analyzes the power consumption of devices in real-time. By combining it with automated testing software, it streamlines the evaluation of power profiles in the development and verification processes. *For more details, please feel free to contact us.

  • QTL3178-E3-Drive-Enclosure-x8-0_setup.png
  • QTL3085-Gen6-EDSFF-x8-0_full.png
  • QPS-hires-image.png
  • SSD
  • Logic Analyzer
  • server
  • Analysis Equipment

Added to bookmarks

Bookmarks list

Bookmark has been removed

Bookmarks list

You can't add any more bookmarks

By registering as a member, you can increase the number of bookmarks you can save and organize them with labels.

Free membership registration

Double Titration Handy Contact Angle Meter / Surface Free Energy Analysis Device MSA

A highly popular model that allows surface free energy analysis in just 1 second!

The world's first air pressure-based double titration system allows for the measurement of the contact angles of two liquids simultaneously with a single click, calculating surface free energy in as little as one second. With fully automated measurements, human error is minimized to the greatest extent.

  • Other measurement, recording and measuring instruments
  • Analysis Equipment

Added to bookmarks

Bookmarks list

Bookmark has been removed

Bookmarks list

You can't add any more bookmarks

By registering as a member, you can increase the number of bookmarks you can save and organize them with labels.

Free membership registration

Deprotection Reaction Analysis Device PAGA Series

We provide various devices for advanced evaluation of photoresists.

The Deprotection Reaction Analysis Device PAGA series features in-situ reaction analysis using PEB and 248mm exposure, as well as the capability to calculate deprotection reaction parameters. A bake plate is placed in the FT-IR chamber, allowing for the observation of functional group changes while heating. Additionally, it is equipped with a UV (248nm) irradiation device, which can also be used to analyze mechanisms of acid generation during exposure. For more details, please contact us or refer to the catalog.

  • Other process controls
  • Spectroscopic Analysis Equipment
  • Analysis Equipment

Added to bookmarks

Bookmarks list

Bookmark has been removed

Bookmarks list

You can't add any more bookmarks

By registering as a member, you can increase the number of bookmarks you can save and organize them with labels.

Free membership registration

Rapid Eye Movement Analysis Device "EyeLink Portable Duo"

The new EyeLink allows for easy and high-precision eye tracking anywhere.

Measuring with the EyeLink Portable Duo is easy; you just need to connect the camera to a laptop. High-precision eye tracking can be easily done anywhere, such as in clinics, offices, labs, or at home. It can also be used with a laptop or simply by using a tripod for head stabilization, allowing for flexible usage. You can conveniently carry the dedicated laptop and camera in a specialized carry bag, making transportation easy without the need for special packaging.

  • Other measurement, recording and measuring instruments
  • Analysis Equipment

Added to bookmarks

Bookmarks list

Bookmark has been removed

Bookmarks list

You can't add any more bookmarks

By registering as a member, you can increase the number of bookmarks you can save and organize them with labels.

Free membership registration

High-Speed Eye Movement Analysis Device "EyeLink 1000 PLUS Series"

Customizable according to the purpose, it accommodates various experimental conditions.

The basic system allows for the selection of lenses/camera mounts according to the task. It consists of four types: desktop, tower, remote, and arm. The video-based eye tracking system can also be expanded to the world's fastest 2000Hz sampling. Thanks to the special image processing technology integrated into the EyeLink1000 PLUS, stable measurements can be conducted for extended periods with low noise and minimal drift, allowing for the capture of highly accurate data. <Standard Camera Mount> ■ Desktop Type: This type involves placing the eye camera under the stimulus presentation monitor and having the subject rest their face on a headrest for measurement. ■ Tower Type: This type uses a half mirror to capture images of the eyeball, allowing the camera to view the eyeball from the front. ■ Remote Type: This type allows for non-contact measurement, reducing the burden on the subject. ■ Arm Type: This type involves attaching the eye camera to the bottom of the visual stimulus presentation monitor.

  • Other measurement, recording and measuring instruments
  • Analysis Equipment

Added to bookmarks

Bookmarks list

Bookmark has been removed

Bookmarks list

You can't add any more bookmarks

By registering as a member, you can increase the number of bookmarks you can save and organize them with labels.

Free membership registration

[Example of analysis using EBSD] Chip

I will introduce an example of analysis using EBSD where orientation was observed in the Al wiring.

We will introduce an example of analysis of the chip surface wiring (Al) using EBSD. The package resin was opened using a chemical solution/RIE, and an analysis of the Al pattern on the chip surface was conducted using EBSD. As a result, orientation was observed in the Al wiring. The normal orientation is distributed, and it is believed that many crystals are present. 【Overview】 ■ Analysis Method - The package resin was opened using a chemical solution/RIE. - An analysis of the Al pattern on the chip surface was conducted using EBSD. ■ Results - Orientation was observed in the Al wiring. *For more details, please refer to the PDF document or feel free to contact us.

  • image_03.png
  • image_04.png
  • image_05.png
  • image_06.png
  • image_07.png
  • image_08.png
  • image_09.png
  • image_01.png
  • Analytical Equipment and Devices
  • Analysis Services
  • Analysis Equipment

Added to bookmarks

Bookmarks list

Bookmark has been removed

Bookmarks list

You can't add any more bookmarks

By registering as a member, you can increase the number of bookmarks you can save and organize them with labels.

Free membership registration

Example of analysis using EBSD: Via

The EBSD method allows for the estimation of crystal size distribution and residual stress.

We will introduce an example of analysis using EBSD for vias (Cu) formed in a multilayer substrate. With the EBSD method, it is possible to infer the distribution of crystal sizes and residual stress. Additionally, by highlighting on the map, the features that appear in the graph can be visualized. 【Overview】 ■Observation of crystal structure using EBSD ・IPF map ・GROD map ・Crystal grain distribution map *For more details, please refer to the PDF document or feel free to contact us.

  • image_02.png
  • image_03.png
  • image_04.png
  • image_05.png
  • image_06.png
  • Analytical Equipment and Devices
  • Analysis Services
  • Analysis Equipment

Added to bookmarks

Bookmarks list

Bookmark has been removed

Bookmarks list

You can't add any more bookmarks

By registering as a member, you can increase the number of bookmarks you can save and organize them with labels.

Free membership registration

Narrowing down defective areas using the EBAC (Absorption Current) method.

"SEM images" and "absorption current images (current sensing)" etc.! It identifies open defects in wiring and areas with high resistance defects.

Our company provides analysis and reliability evaluation services. In the "Narrowing Down Defective Areas Using the EBAC (Absorbed Current) Method," we identify open defects and high-resistance areas in wiring using the EBAC method with a nano-probe and high-sensitivity amplifier. By sensing the absorbed current as voltage, we can obtain a contrast based on the resistance division within the wiring, allowing us to detect high-resistance defects in TEGs such as via chains. [Analysis Examples Using the EBAC Method] ■ SEM Images ■ Overlaid Images ■ Absorbed Current Images (Current Sensing) ■ Absorbed Current Images (Voltage Sensing) *For more details, please refer to the PDF materials or feel free to contact us.

  • 2020-08-18_15h13_34.png
  • 2020-08-18_15h13_39.png
  • 2020-08-18_15h13_43.png
  • 2020-08-18_15h13_46.png
  • 2020-08-18_15h14_03.png
  • 2020-08-18_15h13_50.png
  • Analysis Services
  • Contract Analysis
  • Analysis Equipment

Added to bookmarks

Bookmarks list

Bookmark has been removed

Bookmarks list

You can't add any more bookmarks

By registering as a member, you can increase the number of bookmarks you can save and organize them with labels.

Free membership registration

Example of analysis using EBSD (ceramics)

Examples of analysis using EBSD, such as 'Observation/Elemental Analysis' and 'Analysis by EBSD'!

This is an example of analysis using EBSD for ceramics (Al2O3). In the "Observation/Elemental Analysis," it was determined to be Al2O3 based on elemental analysis using EDX, and it was observed that Si was scattered as shown in the map. In the "Analysis using EBSD," the distribution of crystal size and orientation can be confirmed using the EBSD method, and by highlighting the map, the features that appeared in the graph can be visualized. [Analysis Overview] ■ Observation/Elemental Analysis - Observation using SEM and elemental analysis using EDX ■ Analysis using EBSD - Observation of crystal structure using EBSD *For more details, please refer to the PDF document or feel free to contact us.

  • 2020-09-10_16h19_39.png
  • 2020-09-10_16h19_46.png
  • 2020-09-10_16h19_50.png
  • 2020-09-10_16h20_03.png
  • Contract Analysis
  • Analysis Services
  • Analysis Equipment

Added to bookmarks

Bookmarks list

Bookmark has been removed

Bookmarks list

You can't add any more bookmarks

By registering as a member, you can increase the number of bookmarks you can save and organize them with labels.

Free membership registration

[Data] Whisker Analysis by EBSD

Introducing a case study analyzing whiskers that occurred on the lead terminals of an IC package!

This document introduces a case study on whiskers that occurred on the lead terminals of IC packages, where cross-sections were created through mechanical polishing, followed by SEM observation and EBSD analysis. It includes surface SEM images of the IC package as well as cross-sectional SEM images. It is evident that the crystal grains and grain boundaries measured by the EBSD method are consistent. We encourage you to read it. 【Published Cases】 ■Observation/Cross-section Preparation ■Analysis by EBSD *For more details, please refer to the PDF document or feel free to contact us.

  • Other contract services
  • Contract Analysis
  • Analysis Services
  • Analysis Equipment

Added to bookmarks

Bookmarks list

Bookmark has been removed

Bookmarks list

You can't add any more bookmarks

By registering as a member, you can increase the number of bookmarks you can save and organize them with labels.

Free membership registration

Crystal analysis by EBSD: Aluminum weld joint (spot welding)

We will introduce an analysis example confirming that the welded area has a large distribution of grain crystals.

As a case study of EBSD, we conducted an analysis of the cross-section of an aluminum welding joint from the cross-sectional direction, which I would like to introduce. For a sample where an aluminum plate was spot welded to an aluminum case, we prepared a cross-section of the weld and performed EBSD analysis. In the distribution of grain sizes, it was confirmed that the weld area has a greater number of larger grains compared to the base material. [Analysis Overview] ■ Visualization of Grain Structure - It is evident that the shape and size of the grains in the weld area differ from those in the base material. ■ Distribution of Grain Sizes - It can be confirmed that the weld area has a greater distribution of larger grains compared to the base material. *For more details, please refer to the PDF document or feel free to contact us.

  • image_02.png
  • image_03.png
  • image_05.png
  • image_06.png
  • image_07.png
  • Analysis Services
  • Contract Analysis
  • Analysis Equipment

Added to bookmarks

Bookmarks list

Bookmark has been removed

Bookmarks list

You can't add any more bookmarks

By registering as a member, you can increase the number of bookmarks you can save and organize them with labels.

Free membership registration

Lock-in thermal analysis method

The lock-in thermal analysis method detects slight temperature increases in the current path.

- The IR-OBIRCH function is also included, allowing for further narrowing down of the fault location after identifying the heat generation area through IR-OBIRCH measurement. - By detecting infrared, it is possible to non-destructively identify fault locations without the need for opening the package through etching or removing electrodes. - By using lock-in signals, it is possible to identify heat generation areas with high S/N, enabling cross-sectional analysis such as Slice & View.

  • 打ち合わせ.jpg
  • セミナー.jpg
  • Contract Analysis
  • Contract measurement
  • Contract Inspection
  • Analysis Equipment

Added to bookmarks

Bookmarks list

Bookmark has been removed

Bookmarks list

You can't add any more bookmarks

By registering as a member, you can increase the number of bookmarks you can save and organize them with labels.

Free membership registration

Overview and Characteristics of SNP Analysis

Differences between real-time PCR method and mass array method.

SNP (Single Nucleotide Polymorphism) refers to the parts of the DNA sequence that differ by a single nucleotide among individuals. It is believed that SNPs can lead to different characteristics such as physical traits and are also related to drug response. Therefore, SNP analysis is expected to be applied in personalized medicine. This document introduces the characteristics of real-time PCR and mass array methods among SNP analysis techniques. It is effective to choose the method according to the specific SNP locations, number of SNPs, and their frequencies that need to be investigated.

  • img_B0298_2.jpg
  • img_B0298_3.jpg
  • img_B0298_4.jpg
  • Contract Analysis
  • Contract measurement
  • Contract Inspection
  • Analysis Equipment

Added to bookmarks

Bookmarks list

Bookmark has been removed

Bookmarks list

You can't add any more bookmarks

By registering as a member, you can increase the number of bookmarks you can save and organize them with labels.

Free membership registration

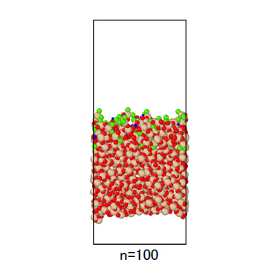
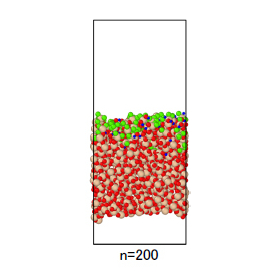
[Analysis Case] HF Etching Simulation of a-SiO2 Film

Effective for understanding surface reactions at the atomic level in the etching process.

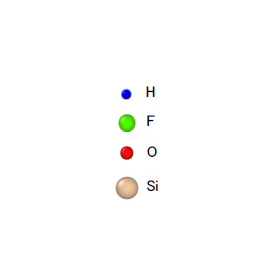
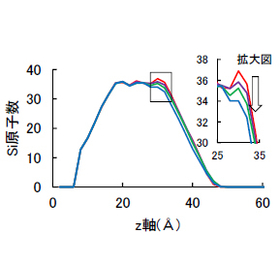
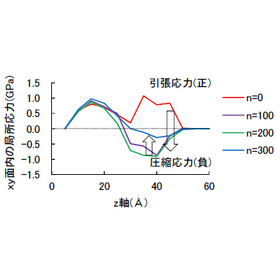
With the miniaturization of semiconductor processes, the importance of surface reactions due to etching gases, precursors in ALD film formation, and plasma treatments is increasing. For systems involving complex chemical reactions such as etching, changes in surface bonding states, and defect generation, analysis using molecular dynamics calculations is effective for understanding phenomena at the atomic level. This document evaluates the HF etching reaction of a-SiO2 using molecular dynamics calculations. A similar approach can be applied to various reactions and materials.

  • img_C0732_1.jpg
  • img_C0732_3.jpg
  • img_C0732_4.jpg
  • img_C0732_6.jpg
  • img_C0732_7.jpg
  • Contract measurement
  • Contract Analysis
  • simulator
  • Analysis Equipment

Added to bookmarks

Bookmarks list

Bookmark has been removed

Bookmarks list

You can't add any more bookmarks

By registering as a member, you can increase the number of bookmarks you can save and organize them with labels.

Free membership registration

TD Imaging | Semiconductor Failure Analysis Device (Heat Measurement)

By using heat reflection and laser technology, LIT narrows down the heat generation points beneath the metal layer, which were difficult to detect, to as small as 2μm, breaking through the limits of heat generation analysis.

TD Imaging is a new heat generation analysis method that uses a laser scanning thermal reflection technique developed and patented by Hamamatsu Photonics. Compared to a 1300nm near-infrared laser, a 670nm short-wavelength laser achieves over four times the S/N ratio on metal surfaces such as copper and aluminum. Furthermore, it can pinpoint heat generation locations down to 2μm, making it possible to identify defects beneath metal layers, which was difficult with conventional LIT. Additionally, by combining it with LIT, which excels in wide-area detection, the accuracy and efficiency of the entire analysis flow from electrical failure analysis (EFA) to physical failure analysis (PFA) are dramatically enhanced.

  • TD imaging sub2.png
  • TD Imaging サブ.png
  • ThermoDynamic Imaging 2枚.png
  • Semiconductor inspection/test equipment
  • Defect Inspection Equipment
  • Analysis Equipment

Added to bookmarks

Bookmarks list

Bookmark has been removed

Bookmarks list

You can't add any more bookmarks

By registering as a member, you can increase the number of bookmarks you can save and organize them with labels.

Free membership registration

Tohoku Univ. Technology : Cancer prognosis prediction method : T20-2962

Development of prognostic prediction method with the novel radiomic feature based on graph theory

 In recent years, the research field to decode the biological characteristics of lesion (radiomics) by analyzing in global a large number of images extracted from medical image database has attracted attention. One potential application of radiomics is to predict the patient prognosis with tumor disease. However, it is difficult to represent phenotypic information of tumor and local information inside tumor with accuracy, so further progress of this research is required.   In this invention, inventors have developed a new radiomic feature based on graph theory. Medical image processed by graph theory feature, and tumor image with relatively good prognosis have a smaller line density than those with poor prognosis. Moreover, the rad score calculated by graph theory feature can clearly indicate the tumor status change compared to the value calculated by conventional feature. Therefore, this invention is able to predict the cancer treatment prognosis with higher accuracy than conventional method.

  • others
  • Analysis Equipment

Added to bookmarks

Bookmarks list

Bookmark has been removed

Bookmarks list

You can't add any more bookmarks

By registering as a member, you can increase the number of bookmarks you can save and organize them with labels.

Free membership registration

Tohoku University Technology: Rock core orientation method by image analysis: T20-3110

Possible to orientate rock core objectively and automatically

Cylindrical rock sample (rock core) taken from a well is analyzed for underground resources exploitation. Analysis of rock core can be used to estimate subsurface material and to measure physical property of formation in a simple way at low cost. Moreover, if the orientation of rock core at in-situ status is known, it is expected to estimate information on the formation, such as the direction of crustal stress, the anisotropy of permeability and the direction of subsurface fault.   There is a conventional method to orientate rock core by tracing the borehole image taken by logging and matching it with the surface image of the rock core. This method takes a long time and leads to a subjective conclusion since the orientation is determined visually.  This invention is about a method to orientate rock core by image analysis, which enables orientation in a shorter time with an objective process than conventional method.

  • others
  • Analysis Equipment

Added to bookmarks

Bookmarks list

Bookmark has been removed

Bookmarks list

You can't add any more bookmarks

By registering as a member, you can increase the number of bookmarks you can save and organize them with labels.

Free membership registration

Tohoku University Technology: Drug Development Focused on the PDI Family: T19-775

Controllable liquid-liquid phase separation of proteins in vitro.

In recent years, the formation of nucleic acid and protein droplets through liquid-liquid phase separation within cells and the elucidation of their functions have garnered attention. The inventors discovered that P5, which belongs to the protein disulfide isomerase (PDI) family that catalyzes the formation of higher-order structures and functional expression of proteins synthesized in cells, forms droplets, and that these droplets incorporate substrates without catalyzing the formation of higher-order structures of the substrates (see right figure). Since the PDI family is known as a target factor for the treatment of neurodegenerative diseases, its application in drug development and elucidation of the mechanisms of onset for these diseases is anticipated. Additionally, as the PDI family is also known as a factor for quality control of disulfide bond-containing proteins such as insulin and antibodies, its application in quality control of these factors is also expected.

  • others
  • Analysis Equipment

Added to bookmarks

Bookmarks list

Bookmark has been removed

Bookmarks list

You can't add any more bookmarks

By registering as a member, you can increase the number of bookmarks you can save and organize them with labels.

Free membership registration

Tohoku University Technology: 3-steps analysis to extract accurate spatial information!: T19-011

Spatial information extraction of floating objects on the sea

In general, the near-infrared band (multispectral band) has worse spatial resolution than the panchromatic band, so its data volume is smaller. In the future, artificial satellites will be able to take images of almost the entire Earth once a day, accumulating a huge amount of data. Analyzing all of these images will require an enormous time and an improvement of computer performance.  This invention is about a method which reduces the analysis time and computer processing power by identifying area 1 where objects are floating on sea using the near-infrared band with low data volume, then making object-based analysis by creating panchromatic band images of the neighborhood area 2. In addition, spatial information such as the floating object size, quantity, location, etc. can be extracted with high accuracy.

  • others
  • Analysis Equipment

Added to bookmarks

Bookmarks list

Bookmark has been removed

Bookmarks list

You can't add any more bookmarks

By registering as a member, you can increase the number of bookmarks you can save and organize them with labels.

Free membership registration

[Application Example] BGA Void Analysis Technology "BGA Pro"

Clearly display the state inside the solder and assist with soldering analysis!

We would like to introduce a product that applies "Smart X-ray." "BGA Pro" assists in soldering analysis by calculating and processing image signal changes of BGA and CSP that are not visible in regular X-ray transmission images, quantifying their size and position, and clearly displaying the internal condition of the solder. 【Applicable Uses】 ■ By quantifying the void state of BGA and CSP, it can evaluate the soldering condition. ■ Understanding the void state can be utilized as information for setting conditions such as reflow. *For more details, please refer to the PDF document or feel free to contact us.

  • X-ray inspection equipment
  • Other measurement, recording and measuring instruments
  • Other image-related equipment
  • Analysis Equipment

Added to bookmarks

Bookmarks list

Bookmark has been removed

Bookmarks list

You can't add any more bookmarks

By registering as a member, you can increase the number of bookmarks you can save and organize them with labels.

Free membership registration

Stereo X-ray Image 3D Analysis Device

A 3D stereo X-ray imaging system completed through joint development with two venture companies!

The "Stereo X-ray Image 3D Analysis Device" provides a high-speed and high-precision 3D measurement method suitable for industrial applications by performing 3D measurements using only X-ray images from two directions, unlike X-ray CT. This product can be applied for various purposes and allows for precise measurement and detailed examination of the bonding wires inside semiconductor packages from multiple viewpoints. 【Features】 ■ High-precision 3D measurement ■ Precise calibration ■ Applicable for various purposes *For more details, please refer to the PDF document or feel free to contact us.

  • X-ray inspection equipment
  • Other measurement, recording and measuring instruments
  • Other image-related equipment
  • Analysis Equipment

Added to bookmarks

Bookmarks list

Bookmark has been removed

Bookmarks list

You can't add any more bookmarks

By registering as a member, you can increase the number of bookmarks you can save and organize them with labels.

Free membership registration

Shipbuilding / Underwater Robot Development Three-Dimensional Motion Analysis Device Qualisys

Wide-ranging support from fishing gear development to shipbuilding, underwater unmanned robot development, and research.

Model ship motion analysis experiments can be conducted over a wide range. Qualisys supports long-range active markers, allowing it to recognize and track model ships located more than 100 meters away, which is impossible with standard markers. By using long-range active markers, it enables motion analysis of objects moving over large distances. Additionally, Qualisys has the world's only optical underwater camera, making it possible to obtain highly accurate underwater motion data that was previously unattainable. This opens up new possibilities for various research areas, including fishing gear, ship propellers, and naval research. Furthermore, by combining ground-based Qualisys cameras with underwater Qualisys cameras, it is also possible to integrate ground data with underwater data.

  • 3D measuring device
  • Other measurement, recording and measuring instruments
  • Testing Equipment and Devices
  • Analysis Equipment

Added to bookmarks

Bookmarks list

Bookmark has been removed

Bookmarks list

You can't add any more bookmarks

By registering as a member, you can increase the number of bookmarks you can save and organize them with labels.

Free membership registration

What is motion capture? - Three-dimensional motion analysis device -

Quantifying people and things

What is a three-dimensional motion measurement device/motion capture? We introduce the principles of motion capture and the features of the Qualisys system. □ What is motion capture? The principles of the Qualisys motion capture system. https://archivetips.com/qualisys/mocap-knowhow

  • 3D measuring device
  • others
  • High Speed Camera
  • Analysis Equipment

Added to bookmarks

Bookmarks list

Bookmark has been removed

Bookmarks list

You can't add any more bookmarks

By registering as a member, you can increase the number of bookmarks you can save and organize them with labels.

Free membership registration

oCelloScope Live Cell Imaging and Analysis System for Microorganisms

Real-time analysis of dynamic changes and morphological changes.

- Live cell imaging and analysis system specialized for microorganisms such as bacteria, fungi, and yeast. - Analyzes dynamics and morphological changes over time from the early stages of proliferation. - Acquires high-precision image data through unique scanning technology. oCelloScope is an optical screening system equipped with software for microbial research. With high-sensitivity image analysis algorithms, it enables rapid and real-time monitoring of microbial growth. - Captures small changes within microscopic images. - Real-time imaging and powerful image analysis capabilities. - Dataizes time-dependent events without missing important changes. - 250 times more sensitive compared to traditional plate reader methods (OD). - Quantifies changes in microorganisms from the early stages. - Achieves growth rate MIC results that take 16 to 20 hours with micro-liquid dilution methods in just 4 to 5 hours. - Quantitatively analyzes changes in microorganisms based on image data-derived proliferation numerical data. - Supports spheroplasts, filamentation, aggregation, and germination of fungal spores, among others.

  • Microbiology
  • Cell Counter
  • Analysis Equipment

Added to bookmarks

Bookmarks list

Bookmark has been removed

Bookmarks list

You can't add any more bookmarks

By registering as a member, you can increase the number of bookmarks you can save and organize them with labels.

Free membership registration

QbD/PAT Integrated Management Orchestration System 'synTQ'

An orchestration system for integrated management of QbD/PAT that contributes to the visualization of complex spectra!

"synTQ" is a QbD/PAT integrated management system that is useful for quality control and product development. It contributes to the visualization of complex spectra by connecting various PAT tools, multivariate statistical analysis tools, and upper-level systems. It has a proven track record in major pharmaceutical companies in Europe and the United States. 【Features】 ■ Connectable with PAT tools, multivariate statistical analysis tools, and upper-level systems ■ Customizable according to user requirements ■ Numerous achievements in major pharmaceutical companies in Europe and the United States *For more details, please refer to the catalog. Feel free to contact us as well.

  • Other operation management software
  • Analysis Equipment

Added to bookmarks

Bookmarks list

Bookmark has been removed

Bookmarks list

You can't add any more bookmarks

By registering as a member, you can increase the number of bookmarks you can save and organize them with labels.

Free membership registration

[Information] High-performance solutions for CAR-T development

In recent years, advancements in assay technology have begun to significantly change the drug discovery and development of CAR-T!

Chimeric antigen receptor T cell (CAR-T) therapy uses genetically modified T cells to fight cancer and holds the potential to revolutionize the medical landscape. However, it is challenging for researchers developing cell-based therapies to explore the complex immune system, especially when using traditional screening and profiling methods. Recently, advancements in assay technology have begun to significantly change the drug discovery and development of CAR-T. These technological advancements have enabled high-throughput, cost-effective analyses that provide speed and sensitivity, yielding deeper biologically relevant information and allowing for the rapid acquisition of practical results. *You can download the English version of the catalog. *For more details, please refer to the PDF materials or feel free to contact us.

  • others
  • Analysis Equipment

Added to bookmarks

Bookmarks list

Bookmark has been removed

Bookmarks list

You can't add any more bookmarks

By registering as a member, you can increase the number of bookmarks you can save and organize them with labels.

Free membership registration

VAM Analysis Device <iOS Compatible Version>

In addition to reading VAM data, settings and monitoring are possible! The read data can be sent via email and analyzed on a PC.

We would like to introduce our iOS-compatible "VAM Analysis Device." By connecting this device, you can analyze the VAM and VAM32 series using an iPad. The connection is made through the IF unit, and communication between the iPad and the IF unit is conducted via Bluetooth (BLE). Our company utilizes the technology developed through selecting LEDs and designing circuit layouts for railway signals and displays to carry out development design and manufacturing (prototyping and mass production). We can solve your problems, such as "I want a warning device like this" or "Can you make something like this with LEDs?" so please feel free to contact us. 【Features】 ■ Analysis of VAM and VAM32 series is possible with an iPad ■ In addition to reading VAM data, settings and monitoring are possible ■ The read VAM data can be sent via email and analyzed on a computer in the office *For more details, please download the PDF or feel free to contact us.

Added to bookmarks

Bookmarks list

Bookmark has been removed

Bookmarks list

You can't add any more bookmarks

By registering as a member, you can increase the number of bookmarks you can save and organize them with labels.

Free membership registration