We have compiled a list of manufacturers, distributors, product information, reference prices, and rankings for Analysis Software.
ipros is IPROS GMS IPROS One of the largest technical database sites in Japan that collects information on.

Analysis Software Product List and Ranking from 287 Manufacturers, Suppliers and Companies | IPROS GMS

Last Updated: Aggregation Period:Jul 29, 2026~Aug 25, 2026
This ranking is based on the number of page views on our site.

Analysis Software Manufacturer, Suppliers and Company Rankings

Last Updated: Aggregation Period:Jul 29, 2026~Aug 25, 2026
This ranking is based on the number of page views on our site.

  1. ウェーブフロント 本社 Kanagawa//software
  2. null/null
  3. 日本イーエスアイ Tokyo//software
  4. 4 ミューテック Tokyo//software
  5. 5 日本ケイデンス・デザイン・システムズ社 Kanagawa//software

Analysis Software Product ranking

Last Updated: Aggregation Period:Jul 29, 2026~Aug 25, 2026
This ranking is based on the number of page views on our site.

  1. Lighting and optical analysis software "Lighting Simulator CAD" Camerium
  2. Fatigue Life Prediction Analysis Software 'FEMFAT' マグナ・インターナショナル・ジャパン マグナパワートレイン・ECS(Engieering Center Steyr)
  3. Welding analysis software SYSWELD/VisualAssembly 日本イーエスアイ
  4. 4 Impact and Collision Analysis Software PAM-CRASH 日本イーエスアイ
  5. 5 Network Camera Recording Playback and Image Analysis Software KxViewPro4 ネットカムシステムズ

Analysis Software Product List

721~750 item / All 1297 items

Displayed results

VR molecular structure sharing software "MolCollabo"

It is a VR-compatible molecular viewer that allows for collaboration!

MolCollabo is software that displays biomolecules such as proteins and nucleic acids in 3D on a head-mounted display, allowing for a VR experience. By connecting VR spaces through network communication, multiple users, including those in remote locations, can share and view the displayed molecular structures, facilitating communication with researchers involved in structural analysis and molecular simulations. It is also possible to set up and operate using only a PC screen. A development kit (Asset) for the game development engine Unity is included, allowing users to extend functionality, making it ideal for creating educational materials and research resources. 【Recommended Operating Environment】 ■ OS: Windows 10/11 ■ CPU: Intel i5-4590 / AMD FX 8350 or equivalent ■ Memory: 4GB or more ■ GPU: NVIDIA GeForce GTX 1060 *For more details, please refer to the product documentation or feel free to contact us.

  • Image analysis software
  • Analysis Software

Added to bookmarks

Bookmarks list

Bookmark has been removed

Bookmarks list

You can't add any more bookmarks

By registering as a member, you can increase the number of bookmarks you can save and organize them with labels.

Free membership registration

Protein three-dimensional structure crystal "MolCrystal"

To gain a deeper understanding of the three-dimensional structure of proteins!

"MolCrystal" is a product that features three-dimensional sculptures of molecular structures within crystal glass. By viewing not only the virtual three-dimensional structures on a monitor but also the tangible three-dimensional structures, you can deepen your understanding of proteins. We can accommodate various expressions of molecules according to customer requests, as well as custom crystal sizes beyond standard options, so please feel free to consult with us. 【Features】 ■ Supports PDB, MOL, and MOL2 data formats ■ For proteins, ribbon representation is recommended ■ For small molecules, space-fill and ball & stick representations are also possible ■ Custom orders available *For more details, please refer to the product documentation or feel free to contact us.

  • others
  • Analysis Software

Added to bookmarks

Bookmarks list

Bookmark has been removed

Bookmarks list

You can't add any more bookmarks

By registering as a member, you can increase the number of bookmarks you can save and organize them with labels.

Free membership registration

Research tools for high-stress GaN devices

Research tools for high-stress GaN devices

This explains the theoretical model of GaN multi-quantum wells (MQW) under high stress. It is possible to obtain the following results for GaN device LEDs grown on silicon in arbitrary crystal orientations using the CrossLight device simulator. The tensile stress from the silicon substrate reduces the band gap of the multi-quantum wells (MQW) and results in a longer wavelength. There is a decrease in piezoelectric charges within the multi-quantum wells (MQW). The reduction in internal quantum efficiency (IQE) is caused by the increase in piezoelectric charges at the electron blocking layer (EBL) interface.

Added to bookmarks

Bookmarks list

Bookmark has been removed

Bookmarks list

You can't add any more bookmarks

By registering as a member, you can increase the number of bookmarks you can save and organize them with labels.

Free membership registration

3D TCAD

Approach to Practical 3D Simulation

Three-dimensional process and device simulation using Crosslight's TCAD. The functions and mechanisms are introduced through various devices (CMOS image sensors, LDMOS, FINFET, DMOS, LIGBT) including mesh generation, device structure creation, and analysis. Additionally, simulation using GPUs is also introduced.

Added to bookmarks

Bookmarks list

Bookmark has been removed

Bookmarks list

You can't add any more bookmarks

By registering as a member, you can increase the number of bookmarks you can save and organize them with labels.

Free membership registration

TCAD for power semiconductor devices

Analysis tool for power semiconductor devices using Crosslight Software's TCAD.

This introduces an overview of device simulations using LDMOS with a race track-shaped polysilicon gate and DMOS with a hexagonal polysilicon gate.

Added to bookmarks

Bookmarks list

Bookmark has been removed

Bookmarks list

You can't add any more bookmarks

By registering as a member, you can increase the number of bookmarks you can save and organize them with labels.

Free membership registration

Accelerating FDTD calculations with GPU

Improvement of processing speed in FDTD calculations using GPUs

The 3D lens structure and CIS 3D CMOS image sensor are picked up as benchmark examples. The GPU version of Crosslight's FDTD shows a 66-fold improvement in processing for 3D real device structures. The benchmark results achieved processing speeds equivalent to a Core i7 3930K PC with 10 clusters (equivalent to 60 cores) using an inexpensive GPU card.

Added to bookmarks

Bookmarks list

Bookmark has been removed

Bookmarks list

You can't add any more bookmarks

By registering as a member, you can increase the number of bookmarks you can save and organize them with labels.

Free membership registration

Aspen Energy Analyzer

Contributing to the evaluation, optimization, and decision-making for energy-saving investments in heat exchanger networks based on pinch technology.

In addition to constructing a heat exchanger network on the Heat Exchanger Diagram (HEN) specific to pinch technology, you can utilize it for energy-saving considerations in efficient production processes while checking composite curves, grand composite curves, and shifted composite curves.

  • simulator
  • Analysis Services
  • Analysis Software

Added to bookmarks

Bookmarks list

Bookmark has been removed

Bookmarks list

You can't add any more bookmarks

By registering as a member, you can increase the number of bookmarks you can save and organize them with labels.

Free membership registration

Aspen Fidelis Reliability Analysis Software

Eliminating guess-based reliability assessment with reliability modeling that quantifies risk.

Aspen Fidelis is a discrete event simulator that uses the Monte Carlo method. It predicts system operation and maintenance over the lifecycle, as well as future performance. Aspen Fidelis provides an accurate and comprehensive list of bad actors quantified not only by maintenance but also by revenue and production losses. It can effectively perform lifecycle analysis on assets, including parameters that define asset uptime, overall equipment effectiveness, and other factors such as operating conditions, reliability, and costs.

Added to bookmarks

Bookmarks list

Bookmark has been removed

Bookmarks list

You can't add any more bookmarks

By registering as a member, you can increase the number of bookmarks you can save and organize them with labels.

Free membership registration

Two-Dimensional Finite Element Method Analysis Software 'CADTOOL FEM8'

Low-cost introduction possible! Entry-level CAD tool for finite element method analysis.

"CADTOOL FEM8" is an integrated pre-post solver two-dimensional finite element analysis software that allows for the introduction of finite element method analysis at a low cost. By specializing the analysis target to two dimensions, the price of the software itself is kept low, and since it is a packaged product, there are no annual maintenance fees. It enables easy finite element method analysis without requiring advanced knowledge, making it recommended for designers' CAE in the early stages of design. Since stress distribution and deformation can be quantitatively observed, it expands the design freedom. 【Features】 ■ All-in-one package with integrated pre-post solver ■ Easy operation suitable for designers' CAE in the early stages and beginners of finite element method analysis ■ Three analysis modes: plane stress analysis, plane plate bending analysis, and rotational body stress analysis ■ High-speed automatic creation of accurate meshes ■ High operability that can be used as a calculator *For more details, please refer to the PDF materials or feel free to contact us.

  • Other CAD related software
  • 2D CAD Construction
  • Analysis Software

Added to bookmarks

Bookmarks list

Bookmark has been removed

Bookmarks list

You can't add any more bookmarks

By registering as a member, you can increase the number of bookmarks you can save and organize them with labels.

Free membership registration

Prevent the need to remake molds! 'SOLIDWORKS Plastics'

Ultimate seamless design and analysis! Add-in resin flow analysis software equipped with a rich material database.

"SOLIDWORKS Plastics" is an analysis software that allows designers to perform resin flow analysis during the design phase, enabling improvements in product quality and reductions in the number of prototype experiments. It enables smooth execution of design and analysis within SOLIDWORKS. Additionally, by simulating various molding patterns in advance, it helps avoid various troubles and find optimal injection molding conditions. 【Features】 ■ Analysis can be performed directly on models created in SOLIDWORKS ■ Equipped with two types of meshes: solid mesh and shell mesh, capable of handling diverse shapes ■ Includes features that provide advice on filling possibilities and appropriate ranges of injection pressure, making it user-friendly even for beginners in resin flow analysis ■ Contains a database of over 4,000 materials commonly used both domestically and internationally ■ Capable of avoiding various troubles and finding optimal injection molding conditions *For more details, please refer to the PDF document or feel free to contact us.

  • simulator
  • Thermo-fluid analysis
  • Structural Analysis
  • Analysis Software

Added to bookmarks

Bookmarks list

Bookmark has been removed

Bookmarks list

You can't add any more bookmarks

By registering as a member, you can increase the number of bookmarks you can save and organize them with labels.

Free membership registration

Architecture visualization and analysis tool 'Lattix'

Visualize the structure of software! An essential DSM analysis tool for architecture analysis and improvement.

"Lattix" is a tool that visualizes the overall picture by quickly analyzing software dependencies and representing the software structure in an intuitive and easy-to-understand format. By using this tool, it is possible to clarify the structural risks that the current software faces without spending a vast amount of analysis time. This enables effective countermeasures to be implemented. 【Features】 ■ Visualizes the structure of existing software ■ Increases efficiency in derivative development ■ Analyzes the impact range of code changes ■ Analyzes the structure of software design models *For more details, please refer to the PDF document or feel free to contact us.

Added to bookmarks

Bookmarks list

Bookmark has been removed

Bookmarks list

You can't add any more bookmarks

By registering as a member, you can increase the number of bookmarks you can save and organize them with labels.

Free membership registration

AVEVA PI Server

The AVEVA PI Server is the core product of the AVEVA PI System, equipped with data storage, normalization, analysis, and notification functions.

The AVEVA PI Server includes Data Archive, Asset Framework, Asset Analytics, Event Frames, and Notifications. By combining these features, it enables the secure storage, organization, and contextualization of operational data. Raw data is structured by adding context and performing calculations, which provides insights into operations and business. Additionally, it ensures a reliable audit trail, making it easy to verify compliance with laws, regulations, and industry standards, while robust security covers every aspect to protect valuable data. 【Features】 ■ Safely stores time-series operational data for decades ■ Accessible to anyone within the organization who needs data, regardless of department or position ■ Creates a reliable single data source, regardless of source, format, or age ■ Obtains and compares summary data of events from specific processes ■ Automatically notifies alerts when changes occur in operations *For more details, please refer to the PDF document or feel free to contact us.

  • Company:AVEVA
  • Price:Other
  • Document and Data Management
  • Analysis Software

Added to bookmarks

Bookmarks list

Bookmark has been removed

Bookmarks list

You can't add any more bookmarks

By registering as a member, you can increase the number of bookmarks you can save and organize them with labels.

Free membership registration

[Analysis Case] Calculation of Electromagnetic Force in the Plunger Model

The analytical model for calculating electromagnetic force in the plunger model was a three-dimensional model.

The calculation of electromagnetic force in the plunger model was performed for the plunger model proposed by the Institute of Electrical Engineers for electromagnetic force verification, where the electromagnetic force acting on the center pole and the magnetic flux density of each part of the model were calculated when current was passed through the coil. For more details, please download the catalog.

  • Magnetic field analysis/electromagnetic wave analysis
  • Analysis Services
  • Contract Analysis
  • Analysis Software

Added to bookmarks

Bookmarks list

Bookmark has been removed

Bookmarks list

You can't add any more bookmarks

By registering as a member, you can increase the number of bookmarks you can save and organize them with labels.

Free membership registration

Thermal Conductivity Analysis Software THERMO

Finite Element Method Thermal Conduction Analysis Software (Simulator)

2D Axisymmetric and 3D Heat Conduction Analysis Simulator using Finite Element Method ■□■Features■□■ ■ Since it is an integrated pre-post tool dedicated to the PHOTO series, data creation, analysis, and result processing can be performed as a series of operations. ■ It is integrated with other PHOTO series modules, allowing for easy coupled analysis, such as obtaining temperature distribution from heat generation calculated by electromagnetic field analysis. ■ It uses the ICCG method, making calculations fast and enabling analysis on a personal computer. ■ Since it employs the finite element method, the solutions are stable, making it user-friendly even for beginners. ■ Coupled calculations with stress analysis and fluid analysis are easy to perform.

  • Thermo-fluid analysis
  • simulator
  • Contract Analysis
  • Analysis Software

Added to bookmarks

Bookmarks list

Bookmark has been removed

Bookmarks list

You can't add any more bookmarks

By registering as a member, you can increase the number of bookmarks you can save and organize them with labels.

Free membership registration

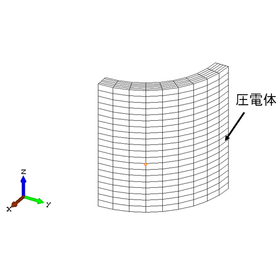
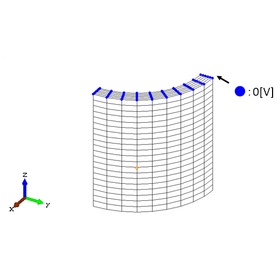
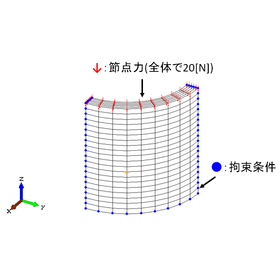
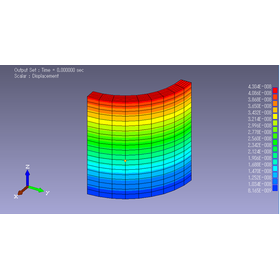
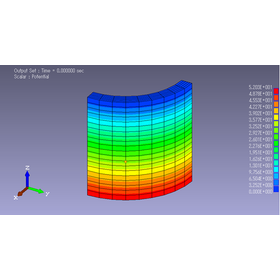
[Analysis Case] Electromechanical Coupled Analysis of Cylindrical Piezoelectric Elements

Focusing on the conversion from force to electricity! The software is PHOTO-ELAS and PHOTO-VOLT.

A piezoelectric material is a dielectric that converts mechanical energy into electrical energy, or vice versa. In this case, force is applied to the upper surface of a cylindrical piezoelectric material, and the resulting voltage is analyzed. Since the equations related to "force" and "electricity" are different, these equations are coupled to analyze the piezoelectric element. Therefore, a coupled analysis of stress and electric field was conducted. The software used for stress analysis and electric field analysis is PHOTO-ELAS and PHOTO-VOLT, respectively. 【Case Overview】 ■ Software Used: PHOTO-ELAS and PHOTO-VOLT ■ Analysis Conditions - Relative Permittivity: 2000 - Young's Modulus: 5×10^10 - Poisson's Ratio: 0.35 - Analysis Modules: VOLT & ELAS *For more details, please refer to the related links or feel free to contact us.

  • 2022-11-21_17h22_18.png
  • 2022-11-21_17h22_23.png
  • 2022-11-21_17h22_29.png
  • 2022-11-21_17h22_36.png
  • 2022-11-21_17h22_41.png
  • Magnetic field analysis/electromagnetic wave analysis
  • Contract Analysis
  • Analysis Services
  • Analysis Software

Added to bookmarks

Bookmarks list

Bookmark has been removed

Bookmarks list

You can't add any more bookmarks

By registering as a member, you can increase the number of bookmarks you can save and organize them with labels.

Free membership registration

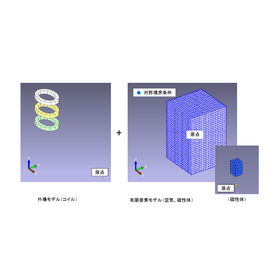
Distribution of analysis cases! Introducing electromagnetic field analysis using convenient external field functions.

The outdoor function in the PHOTO series is effective!

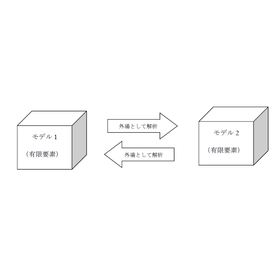
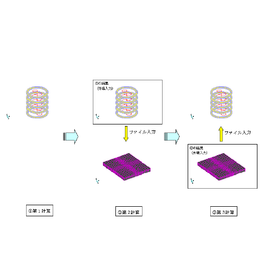
In the PHOTO series, you can set the current density for models such as coils and perform coupled analysis with finite element models (such as magnetic materials) that are influenced by it, using it as an external field model.

  • gaiba2.png
  • gaiba3.png
  • Magnetic field analysis/electromagnetic wave analysis
  • Contract Analysis
  • simulator
  • Analysis Software

Added to bookmarks

Bookmarks list

Bookmark has been removed

Bookmarks list

You can't add any more bookmarks

By registering as a member, you can increase the number of bookmarks you can save and organize them with labels.

Free membership registration

[Analysis Case] Comparison of Theoretical Solutions for Q Factor (Resonator) Using Electromagnetic Wave Analysis

Evaluating the losses occurring on the inner walls of the resonator! Introducing the successful correlation between Q value and theoretical solutions.

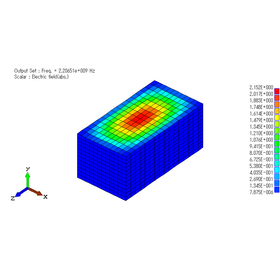
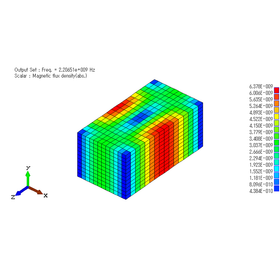
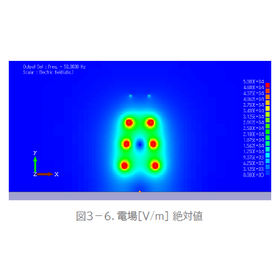
We conducted an electromagnetic field analysis when operating a rectangular cavity in the TE101 mode using our "PHOTO-WAVEjω." We compared the numerical values obtained from the analysis results with theoretical calculations. We created plate elements on the surface of the analysis model, setting the electrical conductivity for these plate elements. We determined the Q value from the internal energy and losses on the inner walls. The values obtained using the analysis software matched well with the theoretical values. 【Case Summary】 ■ Analysis Target: Rectangular Cavity Resonator ■ Resonant Frequency: 2.20651 GHz ■ Software Used: PHOTO-WAVEjω ■ Evaluation Items: Electric Field (Absolute Value) and Magnetic Flux Density (Absolute Value) *For more details, please download the PDF or feel free to contact us.

  • Q値2.png
  • Q値3.png
  • Other analysis software
  • Analysis Software

Added to bookmarks

Bookmarks list

Bookmark has been removed

Bookmarks list

You can't add any more bookmarks

By registering as a member, you can increase the number of bookmarks you can save and organize them with labels.

Free membership registration

[Analysis Case] Electromagnetic Wave Analysis of EH Tuner

Used to suppress reflections from the applicator! Introducing simulation examples of the EH tuner.

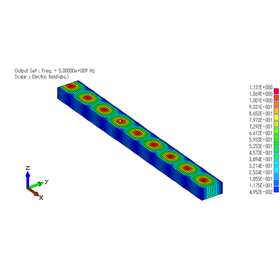
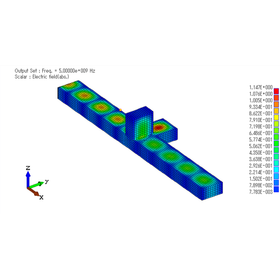
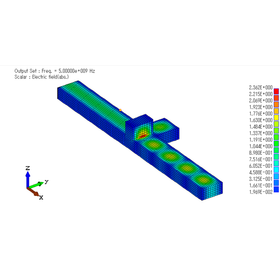
We will introduce our achievements in verifying the reduction of reflected waves using our "PHOTO-WAVEjω." Assuming reflection, we create an impedance mismatch at the exit of the main waveguide, resulting in reflected waves. We adjust the length of the branched waveguide. By making these adjustments, we confirmed that the reflection coefficient can be appropriately suppressed. [Case Overview] ■ Analysis Purpose: Electromagnetic wave analysis of EH tuner ■ Frequency: 5GHz ■ Analysis Module: PHOTO-WAVEjω ■ Evaluation Item: Evaluation using the port's S11 (absolute value) *For more details, please download the PDF or feel free to contact us.

  • EHチューナ2.png
  • EHチューナ3.png
  • EHチューナ4.png
  • Other analysis software
  • Analysis Software

Added to bookmarks

Bookmarks list

Bookmark has been removed

Bookmarks list

You can't add any more bookmarks

By registering as a member, you can increase the number of bookmarks you can save and organize them with labels.

Free membership registration

[Analysis Case] Electric Field Analysis of Overhead Transmission Lines

Confirming the electric field strength generated by overhead power lines! Introducing simulation examples through frequency response analysis.

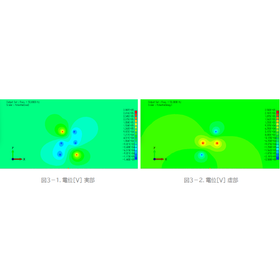
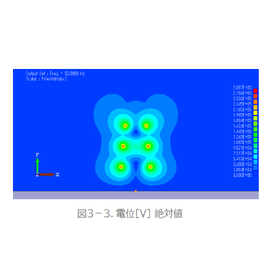
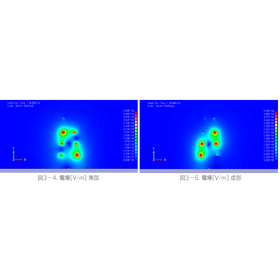
We will introduce a 2D electric field analysis assuming the section between transmission towers using our "PHOTO-VOLTjω." Above the power lines, there are two overhead ground wires. Below is the ground, which is also set to 0V. The analysis results are displayed as complex numbers. The analysis is conducted using the finite element method. 【Case Overview】 ■ Analysis Target: Power lines, ground, and surrounding space ■ Analysis Software Used: PHOTO-VOLTjω ■ Voltage Condition: Each conductor's voltage is 500kV/√3 ■ Analysis Type: 2D electric field analysis *For more details, please download the PDF or feel free to contact us.

  • den2.png
  • den3.png
  • den4.png
  • den5.png
  • Other analysis software
  • Analysis Software

Added to bookmarks

Bookmarks list

Bookmark has been removed

Bookmarks list

You can't add any more bookmarks

By registering as a member, you can increase the number of bookmarks you can save and organize them with labels.

Free membership registration

■Coupled Analysis (Electromagnetic Waves + Heat Conduction) WAVEjω & THERMO

We will perform frequency response analysis using a 3D high-frequency electromagnetic field analysis software (high-frequency electromagnetic field simulator) based on the finite element method.

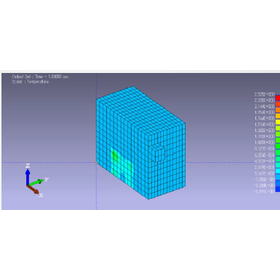
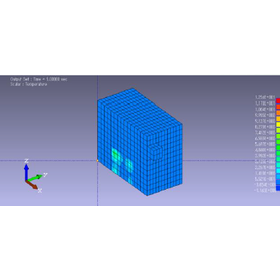
The software for 3D high-frequency electromagnetic field analysis using the finite element method (high-frequency electromagnetic field simulator) performs frequency response analysis. It can handle three-dimensional problems. 【Features】 - Since it is an integrated pre- and post-processor dedicated to the PHOTO series, data creation, analysis, and result processing can be performed as a continuous operation. - A revolutionary speedup has been achieved through the combined use of edge element method and ICCG method (dozens of times faster than conventional finite element methods). - The use of the finite element method ensures stable solutions, making it safe for beginners to use. - It can be coupled with the thermal conduction analysis module PHOTO-THERMO to calculate the temperature distribution of heat generation due to dielectric loss. - Since WAVEjω and THERMO are integrated, the transfer of heat generation density is automatically conducted without the need for files. - It is also possible to use WAVEjω and THERMO separately.

  • ren_w_p2.png
  • ren_w_p3.png
  • Magnetic field analysis/electromagnetic wave analysis
  • Thermo-fluid analysis
  • simulator
  • Analysis Software

Added to bookmarks

Bookmarks list

Bookmark has been removed

Bookmarks list

You can't add any more bookmarks

By registering as a member, you can increase the number of bookmarks you can save and organize them with labels.

Free membership registration

[IGOR Pro Case Study] Semiconductor Quantum Dot Light Source for Quantum Cryptography Communication

Examples of applications used in a wide range of areas such as graph creation, matrix calculations, and numerical solutions of simultaneous differential equations.

We would like to introduce a case where 'IGOR Pro' has been implemented at the Research Institute for Electronic Science, Hokkaido University, in the field of Nano-Optical Functional Materials. The product is utilized for a wide range of applications including organizing experimental data, analysis, fitting, convolution integrals using instrumental functions, simulations (including custom programs), graph creation, matrix calculations, and numerical solutions of simultaneous differential equations. It integrates data organization, advanced analysis, graph plotting, and programming, which means that in most cases, there is no need to use other software, making it a very effective tool, as we have received feedback. 【Reason for Implementation】 ■ It can process everything from loading acquired data to extracting values through fitting, and instantly create high-quality graphs suitable for presentations at conferences. *For more details, please download the PDF or feel free to contact us.

  • 16-2.PNG
  • 16-3.PNG
  • 16-4.PNG
  • Software (middle, driver, security, etc.)
  • Wafer
  • Semiconductors and ICs
  • Analysis Software

Added to bookmarks

Bookmarks list

Bookmark has been removed

Bookmarks list

You can't add any more bookmarks

By registering as a member, you can increase the number of bookmarks you can save and organize them with labels.

Free membership registration