
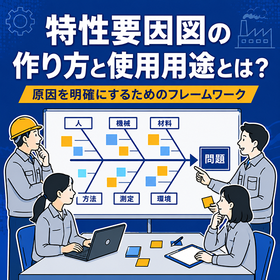
Guide to Utilizing Characteristic Factor Diagrams for the Manufacturing Industry | Quality Improvement Materials
A practical guide to visualize the root causes of quality issues and systematically learn about defect analysis and improvement activities.
Are you facing challenges such as "not knowing the cause" or "countermeasures becoming dependent on individuals" when quality troubles or defective products occur? This document clearly explains a cause analysis method using the "Fishbone Diagram" (also known as the Ishikawa Diagram), one of the seven quality control tools, from basic knowledge to practical creation steps. It introduces analytical frameworks such as 4M, 5M1E, and 8P, combinations with the "5 Whys" analysis, and points for deriving the root cause. This material is recommended for site leaders and quality control personnel in small and medium-sized manufacturing companies working on quality improvement, process improvement, and preventing recurrence. Additionally, it includes case studies on utilizing the production management system "FUSE" as a mechanism to establish improvements after cause analysis. *For more details, please download the PDF or feel free to contact us.*
- Company:日本コンピュータ開発
- Price:Other
![[Software Development Achievements] MLF BL09 Development Support Services](https://image.mono.ipros.com/public/product/image/ddc/2000610322/IPROS34656530660131263961.png?w=280&h=280)

![[Business Improvement Support] Supporting Efficient System Interconnectivity](https://image.mono.ipros.com/public/product/image/e02/2000646273/IPROS59447418468439965685.jpeg?w=280&h=280)

![[Technical Inheritance] Capitalization of Skilled Workers' Know-How](https://image.mono.ipros.com/public/product/image/2001560823/IPROS13284072507537472684.jpg?w=280&h=280)


![[Video Now Available] Introducing Automation AI for the Cutting Processing Industry in an Easy-to-Understand Way](https://image.mono.ipros.com/public/product/image/214/2000628367/IPROS75045115361624086301.png?w=280&h=280)




![[How to Utilize YouSonar] New Approach List Edition](https://image.mono.ipros.com/public/product/image/7c1/2001523293/IPROS13708342888795181001.png?w=280&h=280)
![[UserSonar Case Study] Mitsubishi UFJ Bank, Ltd.](https://image.mono.ipros.com/public/product/image/0bd/2001524726/IPROS15056116194402359707.jpg?w=280&h=280)
![[UserSonar Case Study] Nishimatsu Construction Co., Ltd.](https://image.mono.ipros.com/public/product/image/3ac/2001524735/IPROS13060184453872715276.jpg?w=280&h=280)
![[UserSonar Case Study] Kitz Corporation](https://image.mono.ipros.com/public/product/image/514/2001524736/IPROS16649290773067367075.jpg?w=280&h=280)

![[Introduction Case Study of Kaminashi Report] Hoshiyu Co., Ltd.](https://image.mono.ipros.com/public/product/image/214/2001526725/IPROS11531123566914211457.png?w=280&h=280)


