Specialized Graph Creation for Medical and Clinical Research: SigmaPlot
Clearly create graphs of research results in case comparison.
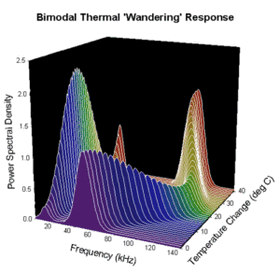
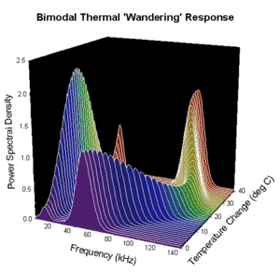
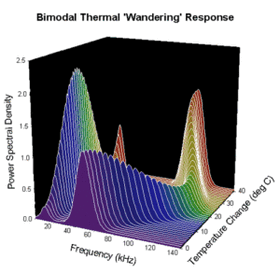
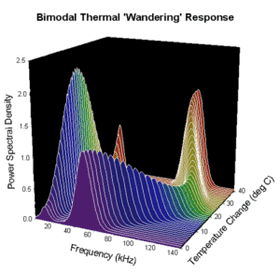
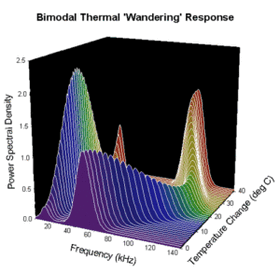
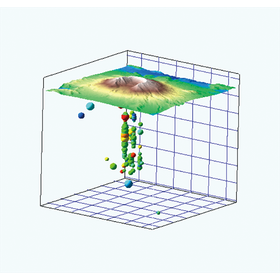
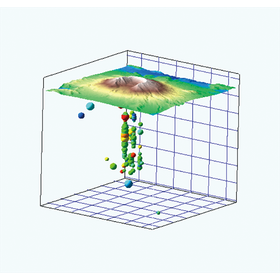
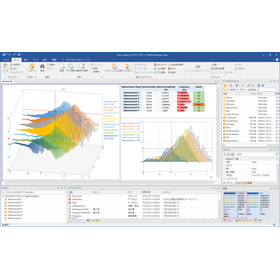
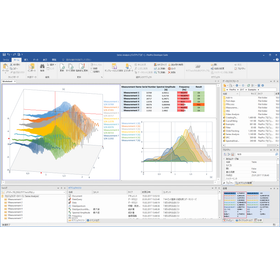
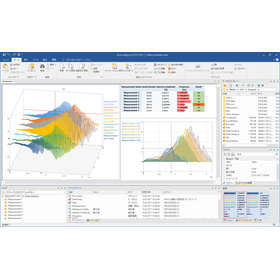
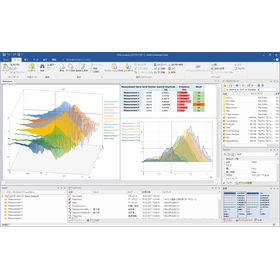
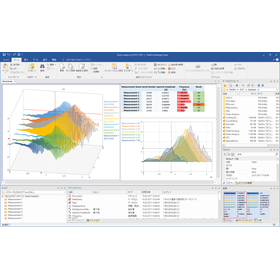
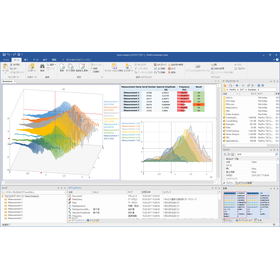
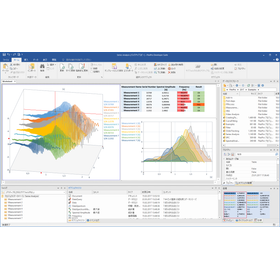
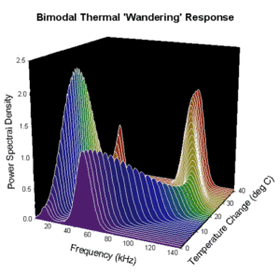
In the field of medicine and clinical research, particularly in case comparisons, it is essential to accurately compare multiple case data and present the results in an easily understandable manner. To enhance the reliability of research findings and ensure successful publication and conference presentations, visual representations that capture the characteristics of the data are indispensable. Inappropriate graphical representations may fail to convey the meaning of the data adequately, potentially undermining the value of the research. SigmaPlot has been designed as a specialized graphing software tailored to meet the needs of such researchers in the field of science and technology. 【Usage Scenarios】 - Creating graphs to compare data from multiple case groups - Visualizing the results of clinical trials - Preparing figures and tables for papers and conference presentations 【Effects of Implementation】 - Clearly visualizing differences between cases - Enhancing the persuasiveness of research results - Reducing time through efficient data analysis and graph creation
- Company:ヒューリンクス
- Price:100,000 yen-500,000 yen