"KaleidaGraph" for Environmental Science Assessment: Survey Data Visualization
Standard tools for graph creation and data analysis.
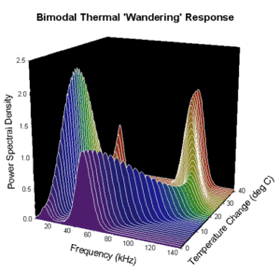
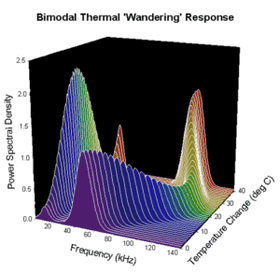
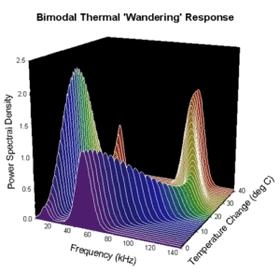
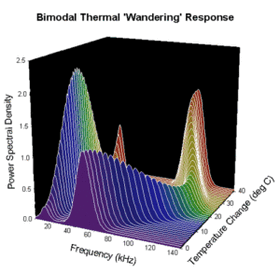
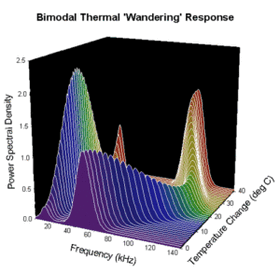
In the field of environmental science, evaluation requires data visualization and detailed analysis. In particular, it is essential to accurately analyze complex data, such as changes in the concentration of environmental pollutants and results from ecosystem surveys, and present it in an understandable format. Inappropriate data processing or graph creation can lead to misinterpretations and inaccurate evaluations. KaleidaGraph addresses these challenges through scientifically accurate graph creation and data analysis. 【Use Cases】 - Analysis of monitoring data for environmental pollutants - Visualization of ecosystem survey data - Data analysis in environmental impact assessments 【Benefits of Implementation】 - Increased efficiency in analysis through data visualization - Highly reliable evaluations based on accurate data analysis - Clear presentation of research results
- Company:ヒューリンクス
- Price:10,000 yen-100,000 yen