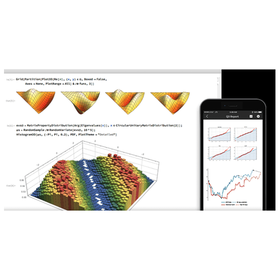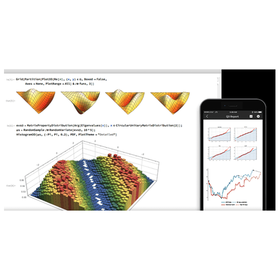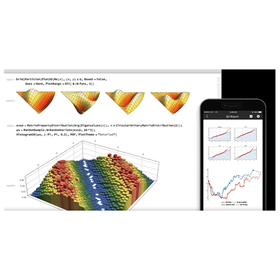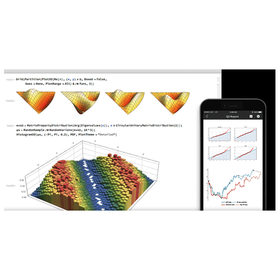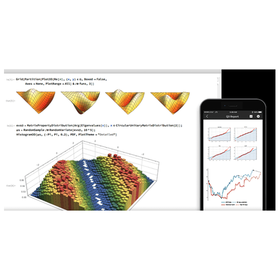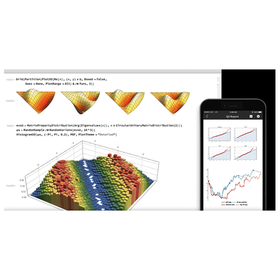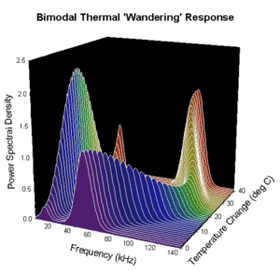
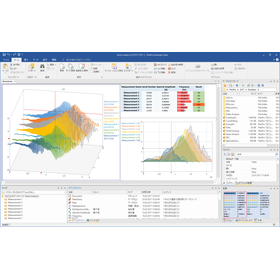
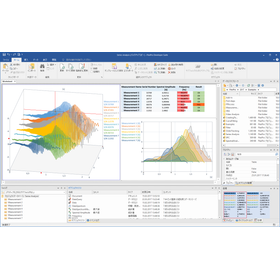
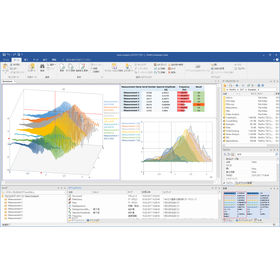
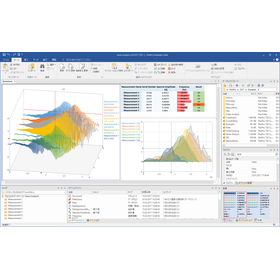
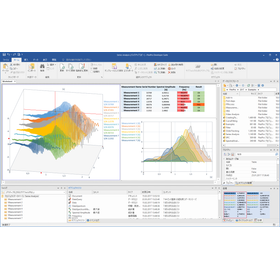
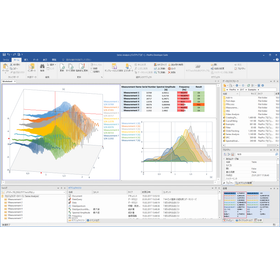
Specialized graph creation software for geology, "SigmaPlot."
Research results in stratigraphic analysis expressed more clearly.
In the field of geology, particularly in stratigraphic analysis, it is essential to accurately visualize the complex structures and data of strata and to express the analysis results clearly. Accurately graphing information such as the depth of strata, types of rocks, and ages, and sharing it in papers and reports is important for enhancing the quality of research. Inappropriate graphical representations can lead to misunderstandings of the data and undermine the reliability of the analysis results. SigmaPlot, as a specialized graphing software focused on science and technology, provides a wealth of features to accurately represent geological research findings. 【Usage Scenarios】 - Creation of stratigraphic cross-sections - Creation of bar charts - Creation of geological maps - Analysis of drilling data - Visualization of sedimentary structures 【Benefits of Implementation】 - Easier visual understanding of the structure and characteristics of strata - Ability to express complex data clearly - Improved quality of papers and presentation materials - Increased efficiency in data analysis Basic Operations of SigmaPlot (link to Hulinks page) https://www.hulinks.co.jp/software/sigmaplot/sigmaplot_bso_guide/
- Company:ヒューリンクス
- Price:100,000 yen-500,000 yen
![[For the Pharmaceutical Industry] Dynamic Analysis Data Processing and Graphing 'Igor Pro'](https://image.mono.ipros.com/public/product/image/2001639147/IPROS3191886065001040709.png?w=280&h=280)
![[For Medical Use] Clinical Data Analysis and Graph Creation 'Igor Pro'](https://image.mono.ipros.com/public/product/image/2001639157/IPROS6763693518471872968.png?w=280&h=280)
![[For the financial industry] Changes to the terms and conditions revision work with 'Old and New Document Word Version'](https://image.mono.ipros.com/public/product/image/2001640362/IPROS8781455822418750386.png?w=280&h=280)






![[For Agriculture] Evaluation of Soil Component Reactivity and Prediction of Improvement Material Effects 'GWB'](https://image.mono.ipros.com/public/product/image/396065/IPROS2783174676671230804.png?w=280&h=280)